
Time's Up for Artificial Food Dyes
Executive Summary
In April this year, the U.S. food industry began a massive transformation of thousands of products as the FDA phases out artificial food dyes due to concerns about childhood neurobehavioral effects.
- US Government Action: The FDA is decertifying some synthetic dyes immediately and strongly encouraging brands to phase out all others. Natural colorings will be used as replacements.
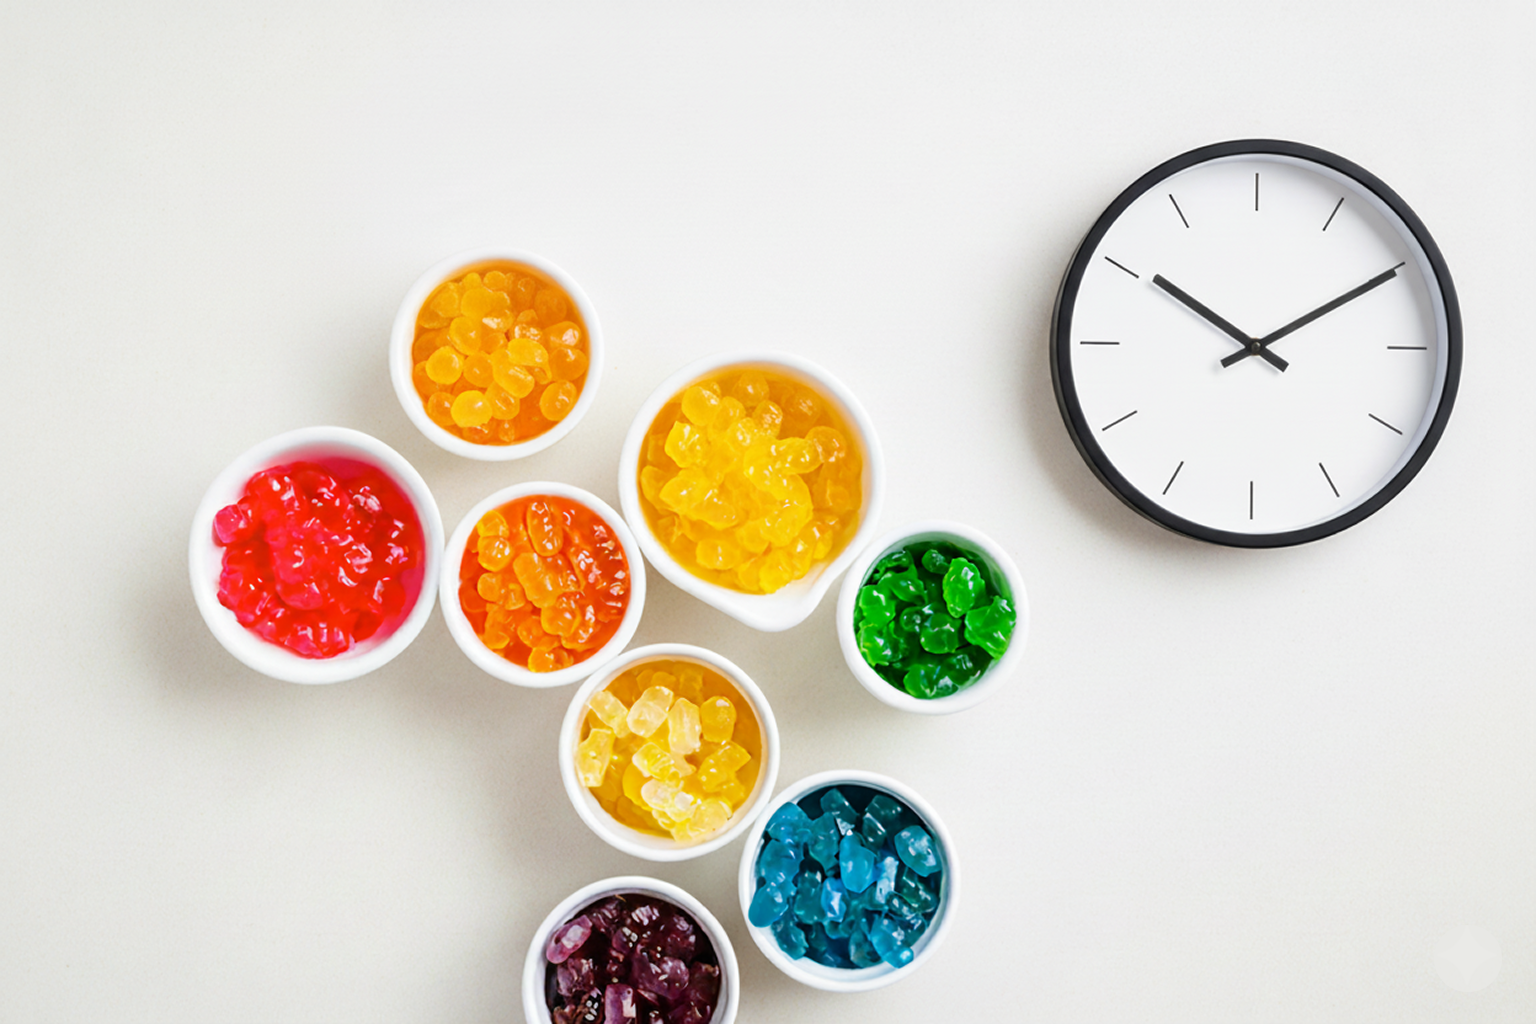
- The Countdown Clock: The FDA has expressed urgency, with expected end dates from 2025 to 2027, depending on the specific color or if products are sold in schools.
- Widespread Impact: The changes will affect thousands of products and touch every phase of the product supply chain, from farming to marketing.
- Industry Support: CPG companies, industry associations, and advocacy groups quickly and publicly expressed support for the FDA initiative, while providing feedback about how and when.
- Challenges & Opportunities: Reformulating products is a "heavy lift." Supply chains will be rebuilt and disruptions are expected.
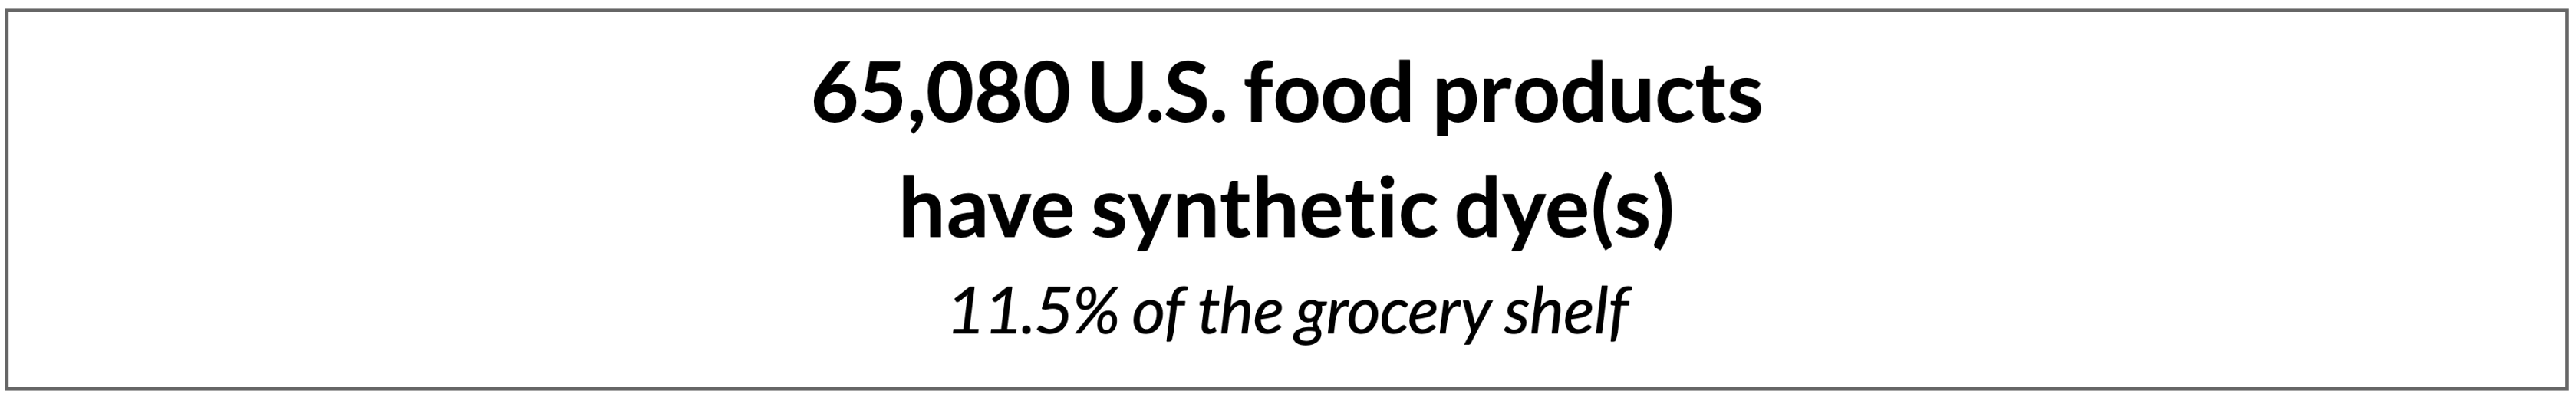
- Foodgraph’s Analysis of Prevalence: We estimate that 11.5% of U.S. packaged food products contain synthetic dyes. In addition to beverage, candy, and other brands, retailer private labelers such as Walmart and Target will be the most affected.
- Unprecedented Scale: This undertaking appears to be among the largest product replacement effort since the 2020 COVID disruptions.
- New Products & Marketing: Beyond ingredient replacement, expect new products and marketing strategies to be launched with natural ingredients and "no artificial colors."
- The Foodgraph Advantage: Foodgraph’s product data platform is ready to help the industry navigate the regulatory revamp into a competitive edge by tracking product changes, measuring FDA compliance, benchmarking against peers, and accelerating innovation using natural ingredients.
Massive product changes lie ahead
Artificial food colorings are front page news in the The Wall Street Journal and industry media because the FDA is decertifying some synthetic dyes and discouraging the use of all others, as announced by Secretary Robert F. Kennedy Jr.
The effects will be felt everywhere, from agriculture to marketing
The upheaval of thousands of food products will cause widespread effects from:
- farming to sourcing
- product formulation to manufacturing
- distribution to operations
- data management to analytics
- advertising to personalization
Why are artificial colorings no more?
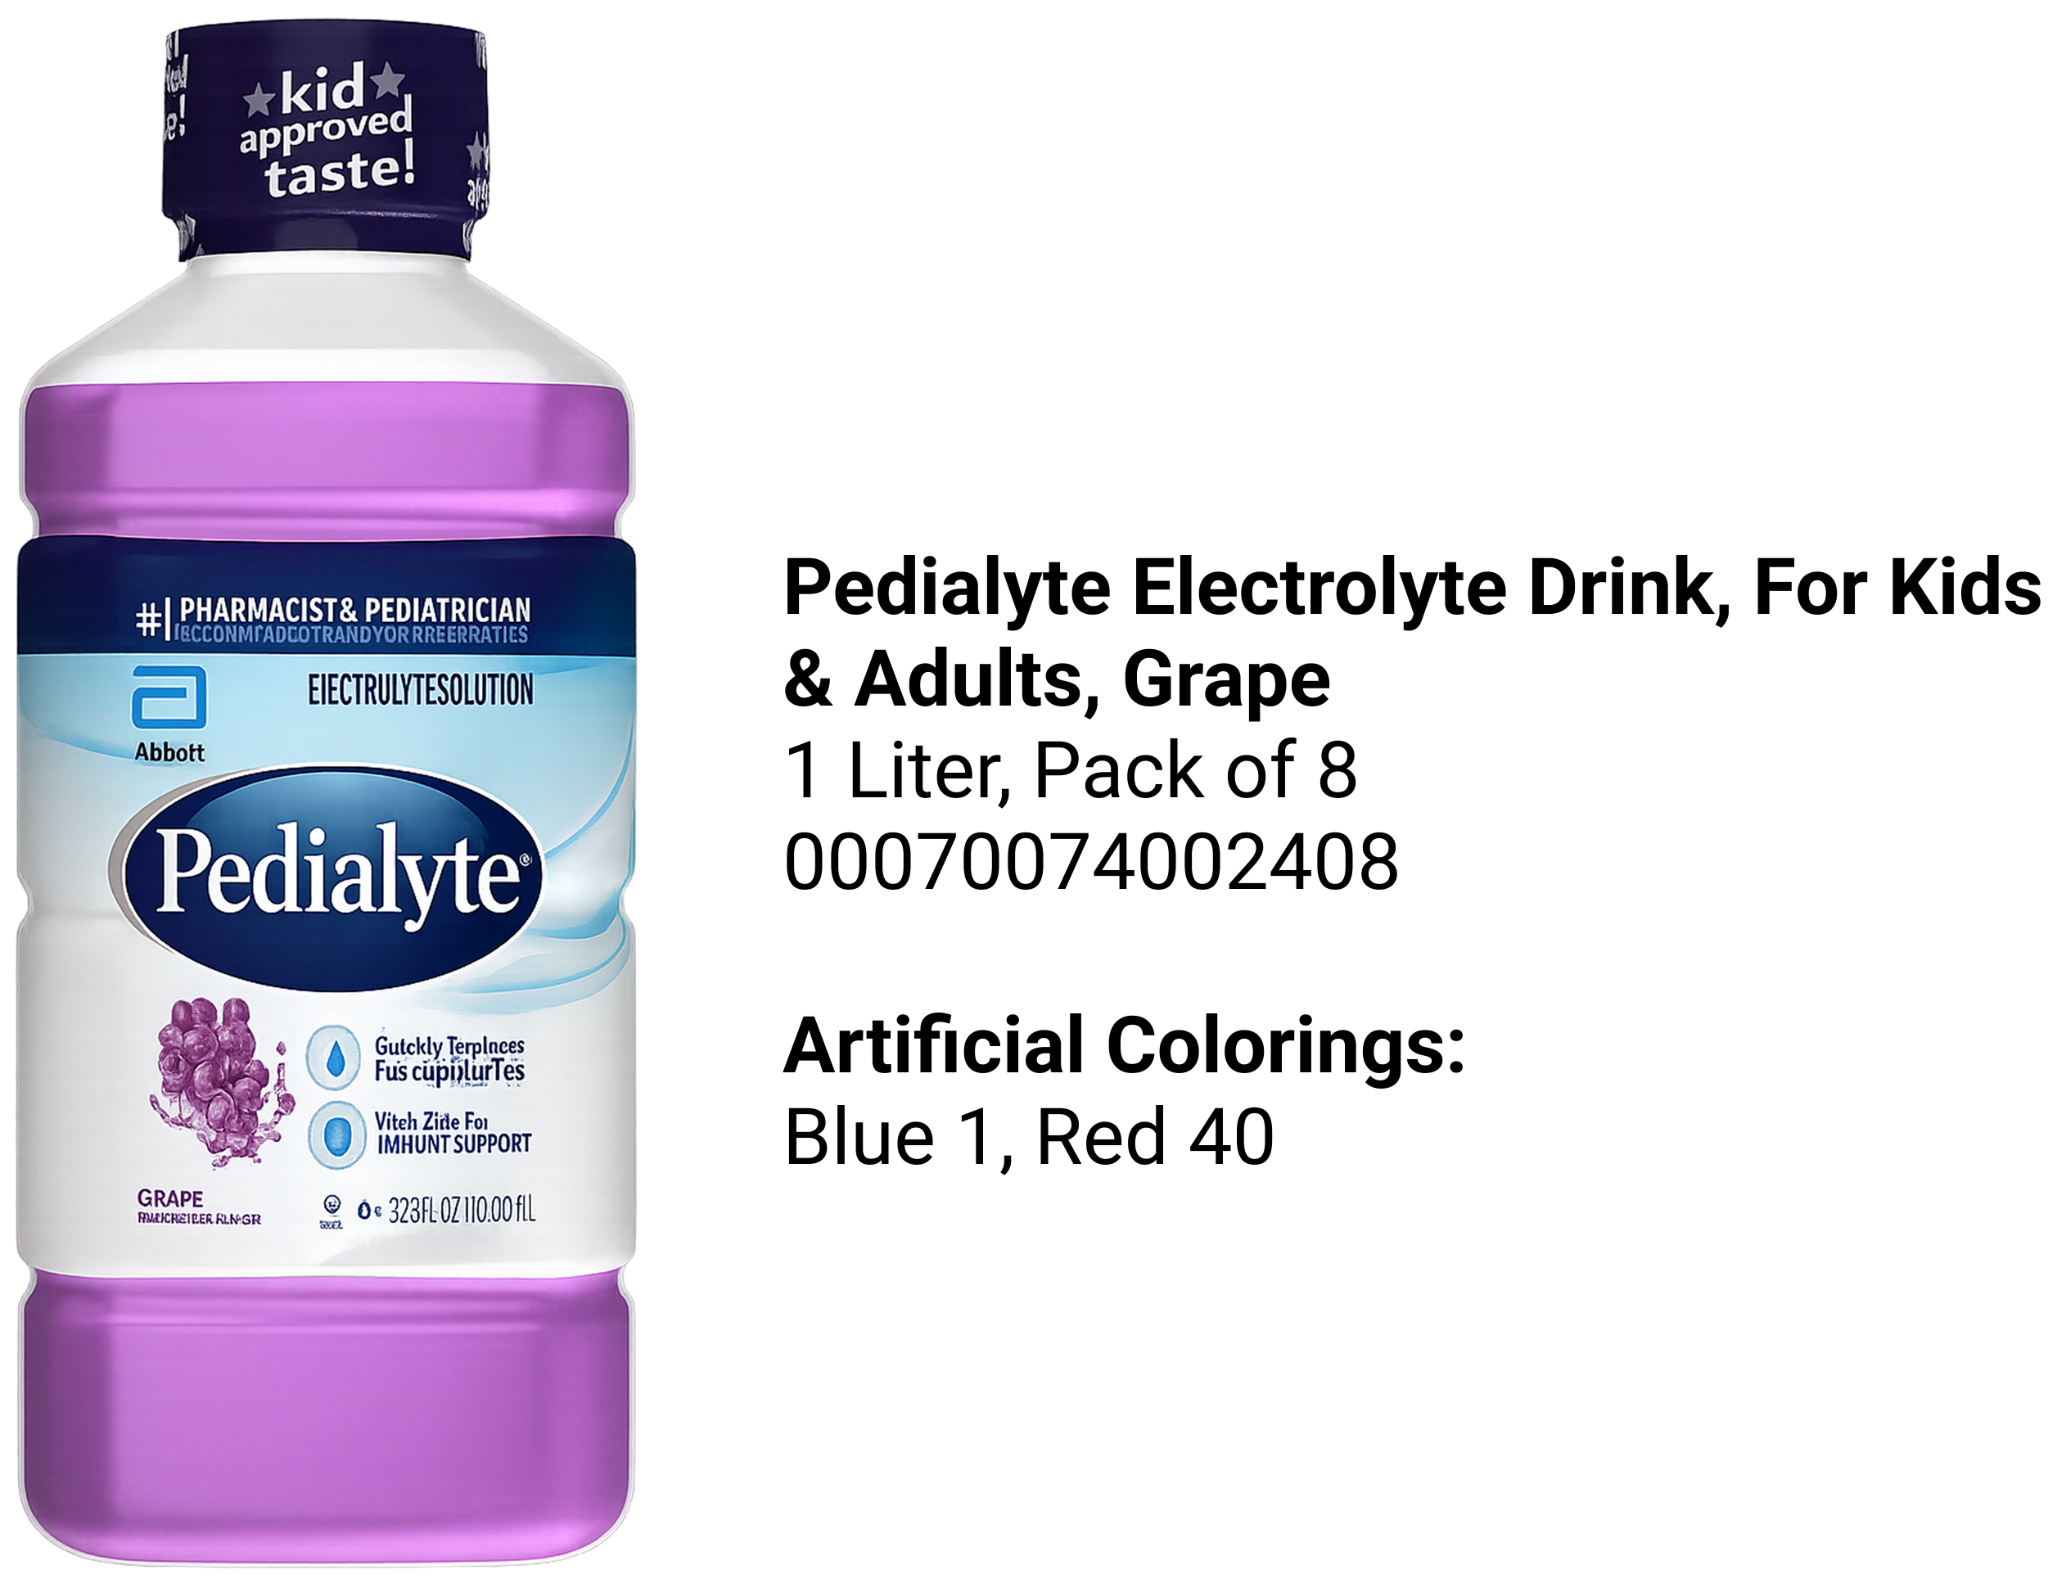
Red #40 and similar ingredients are commonly used in candy, beverages, bakery, cereal -- including health-oriented products marketed for children.
Public policy organizations have long advocated for banning artificial colorings based on extensive research that they can “cause or exacerbate” neurobehavioral problems in children, as described in this scientific review of 27 human clinical trials sponsored by the California EPA.
ALL artificial colorings are affected
The changes are already underway and rolling out from 2025 to 2027.1
- FDA has already or will decertify these artificial colorings:
- FD&C Citrus Red No. 2
- FD&C Orange B
- FD&C Red No. 3
- FDA wants to “eliminate” or “voluntarily phase out” all remaining artificial colorings:
- FD&C Blue No. 1
- FD&C Blue No. 2
- FD&C Green No. 3
- FD&C Red No. 40
- FD&C Blue No. 1
- FD&C Yellow No. 5
- FD&C Yellow No. 6
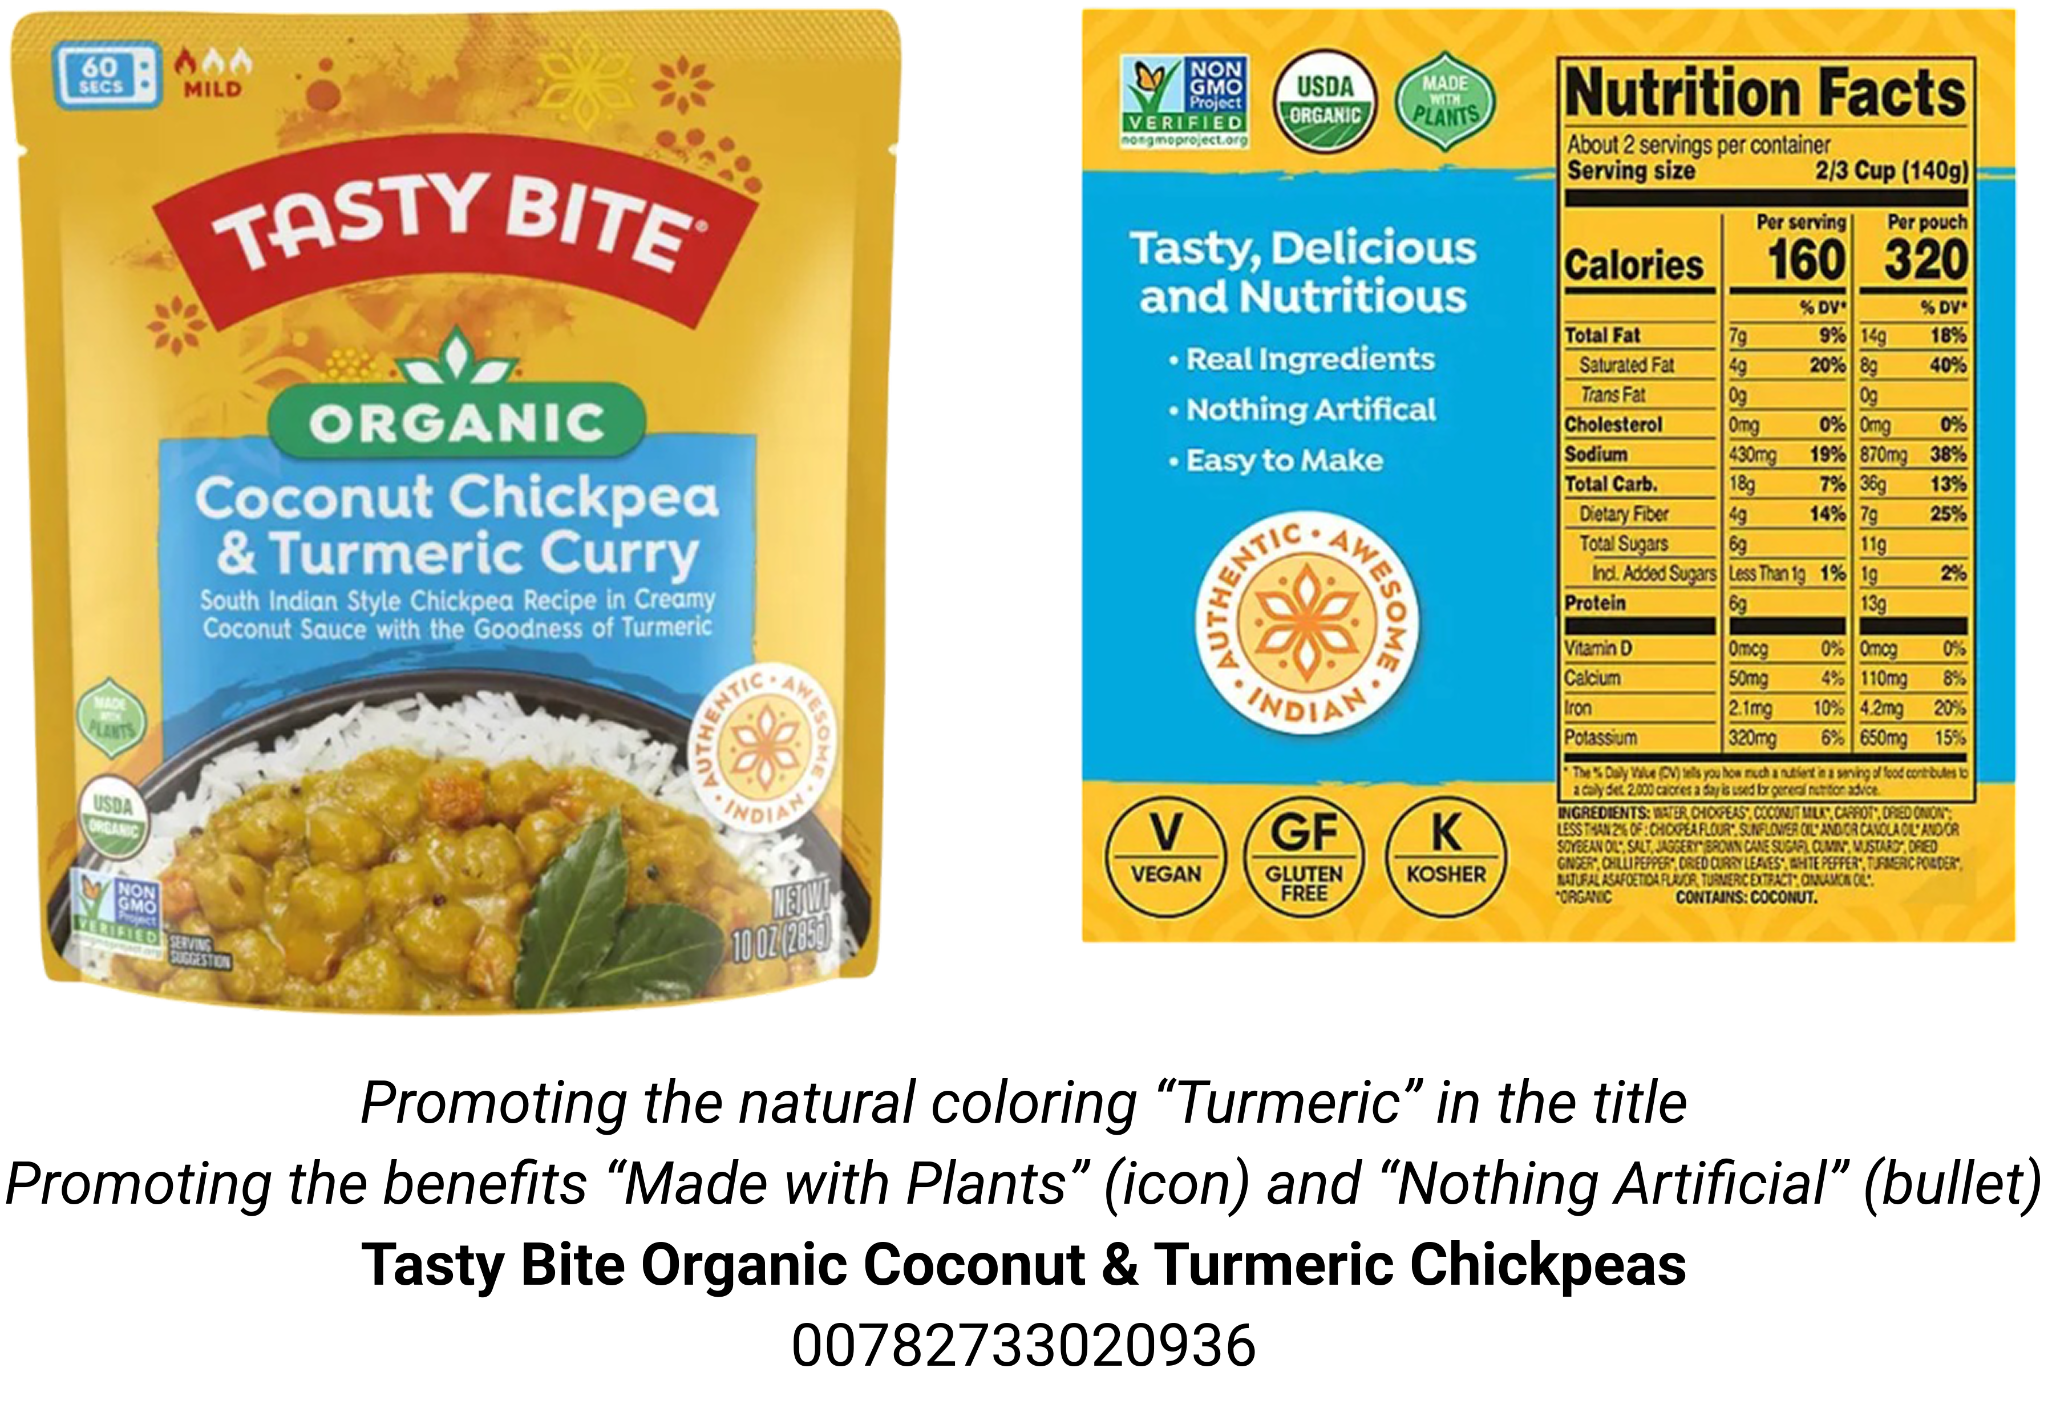
Artificial dyes will be replaced by natural colorings -- such as beet juice (red), caramel (brown), and turmeric (yellow) -- which are derived from vegetables, minerals or animals. Fifty natural additives are already approved per the FDA’s Regulatory Status of Color Additives, some of them for decades.
The industry is on board
Major brands have already announced compliance. Some are enthusiastic about the changes. Others responded positively, but with feedback about when and which products are reformulated:
- Campbell’s, Removing FD&C Colors from Our Portfolio
- Hershey, How and Why Hershey Is Switching to Natural Food Colors
- Kellanova, U.S. Business On Track to Remove FD&C Colors
- and many more major brands.2
Industry organizations -- such as the Food Marketing Institute and the Consumer Brands Association -- quickly and publicly committed to the changes, without appeals or court challenges common in these times. The International Dairy Foods Association even produced a campaign called the Ice Cream Commitment.
Advocacy groups strongly support the initiative:
- The Academy of Nutrition & Dietetics appreciated the FDA’s “commitment to healthy eating.”
- The Center for Science in the Public Interest (CSPI) was even disappointed that the FDA didn’t go farther by banning all synthetic colors, not just asking the industry to phase out some of them.
The Institute of Food Technologists hosted a special panel on color reformulations just a few weeks after the FDA’s announcement.
Foodgraph’s takeaway: Getting rid of synthetic dyes has found a rare alignment of interests.
Product reformulation is a “heavy lift,” but happening quickly
Synthetic food dyes represent 45% of the global market for food coloring ingredients according to FMI, so many product reformulations will need to be accomplished in a short period of time.
CPG companies -- especially in beverages, snacks, bakery, and other categories -- are facing a “heavy lift” to source natural colorings, as detailed by the International Association of Color Manufacturers (IACM).
U.S. coloring manufacturer Sentient Technologies of Milwaukee -- whose stock is up about 40% since Kennedy’s announcement (NYSE:SXT) -- estimates it will need 10x the amount of the current supply of natural colorings to meet demand.3
The certain winners will be color additive manufacturers, especially American companies4, due to:
- Shorter supply chains, with about 82% of food products listing “USA” as the country of origin (source: Foodgraph).
- Reduced costs for transportation and storage versus foreign ingredient manufacturers to mitigate shelf-life limitations for natural colorings and when refrigeration is required.
- Tariff costs and uncertainties making foreign ingredients less attractive.
In some cases, CPG brands have already created product versions with natural colorings for non-U.S. markets, for example, by using beet juice or paprika extract instead of FD&C Red 40. Nevertheless, sourcing natural ingredients, gearing up manufacturing changes, and relabeling U.S. products will cause significant supply chain disruptions.
The implementation timeline is further compounded by the simultaneous nature of the rollout across brands and as stipulated by the FDA.
Foodgraph Analysis: How prevalent are artificial colorings?
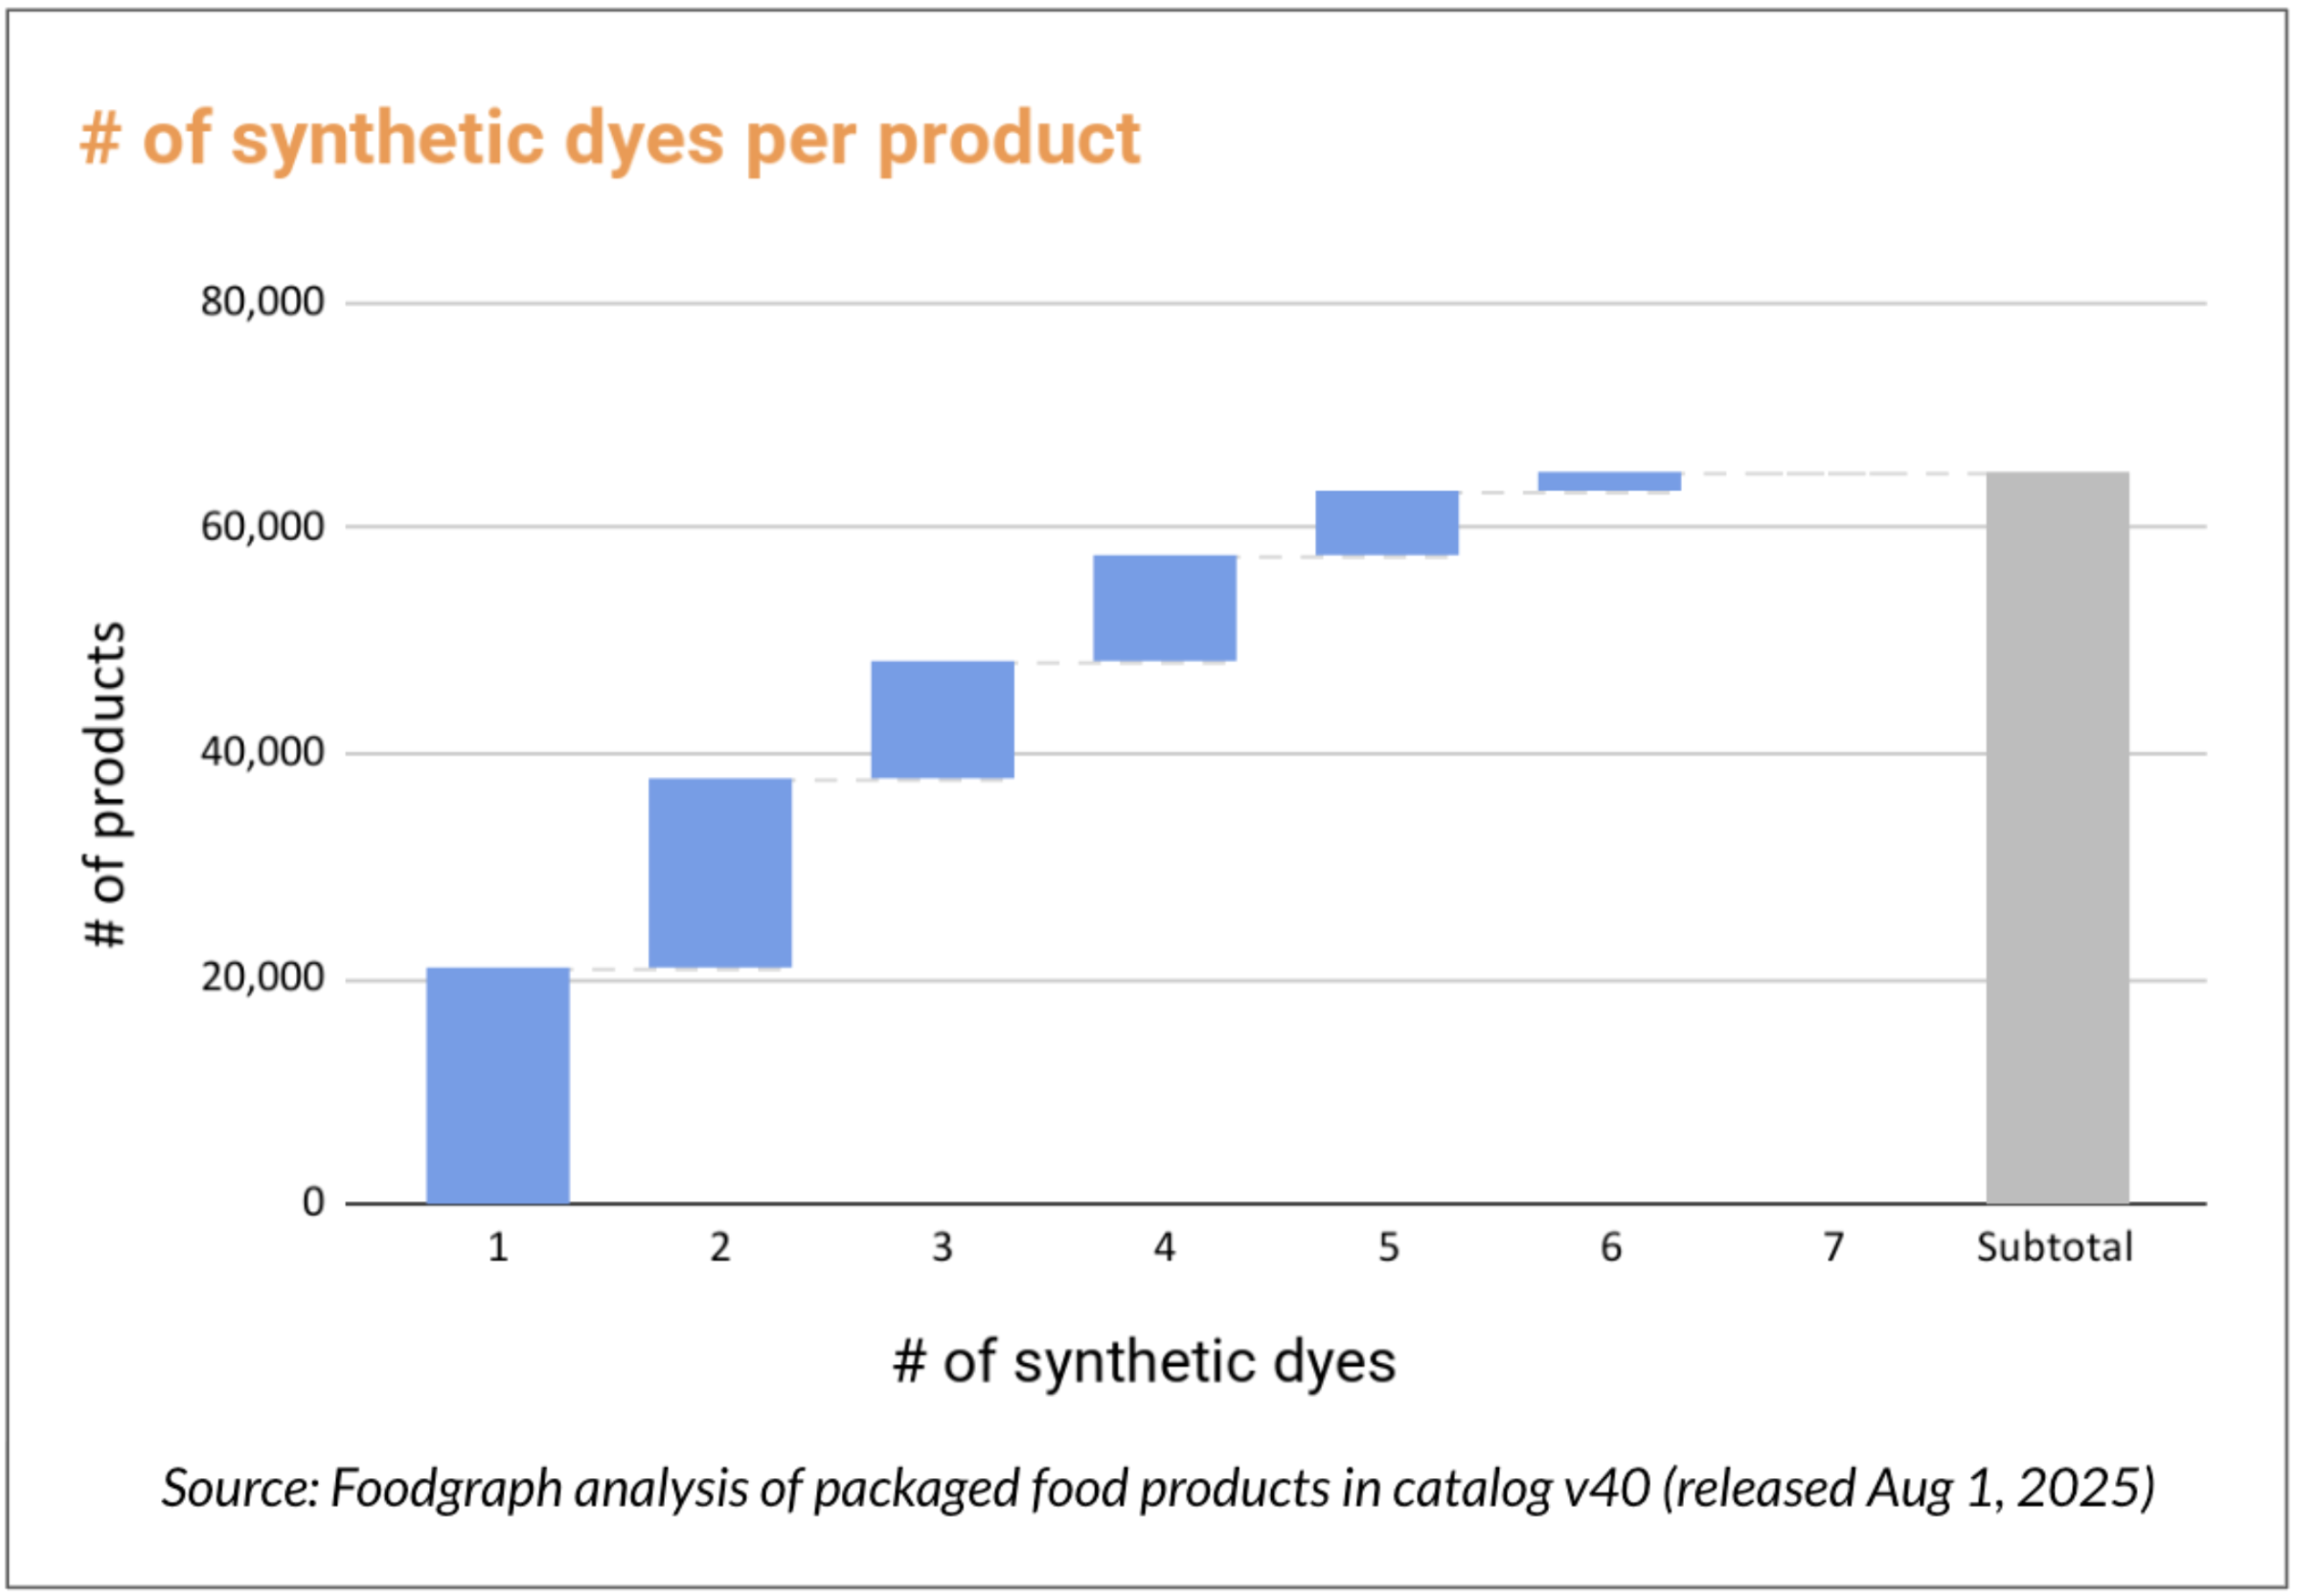
We analyzed Foodgraph’s catalog of grocery product data to find out. Our catalog curates the largest and freshest data about products from large brands (like Mars Wrigley), small and medium brands (like Mt. Olive), and private label brands (like Walmart’s Great Value). This analysis includes packaged food products only, which were offered between September 2021 and July 2025.5
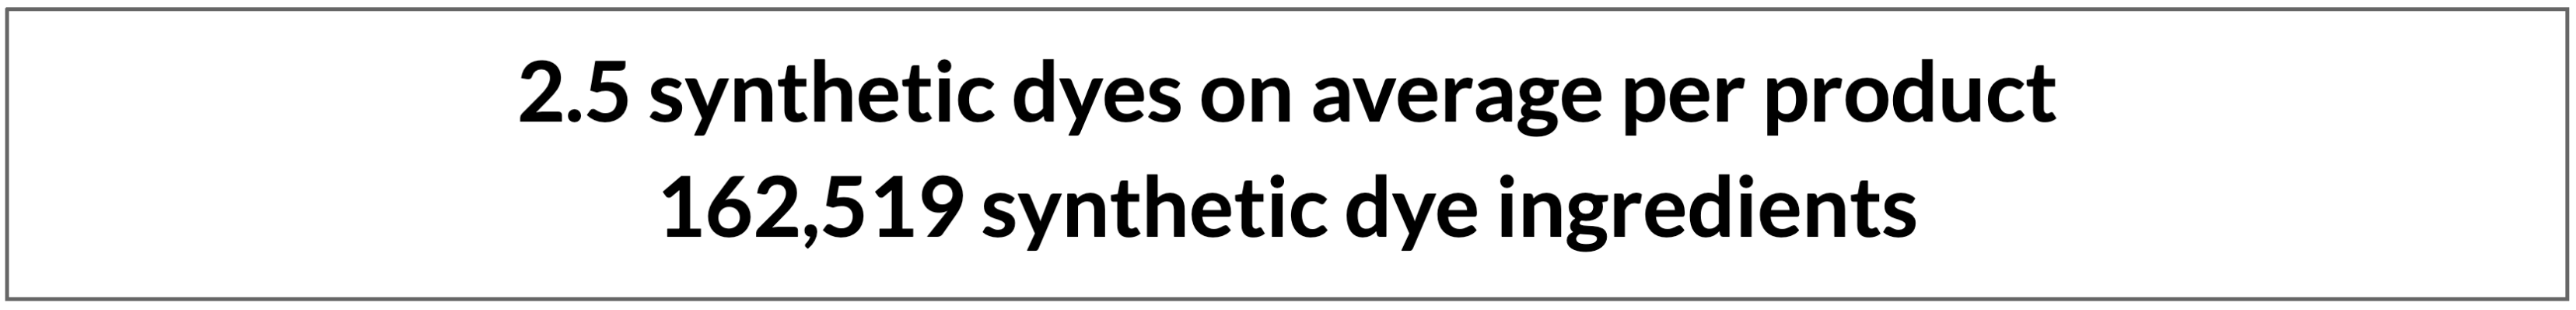
Most of the products with synthetic dyes have more than one artificial coloring in the ingredients list. With up to 7 synthetic dyes per product, managing the changes will be more complicated. Multi-dye products are due to one or more reasons:
- color mixes to create new colors or shades (e.g. Blue 1 and Red 3 to make purple)
- multiple colors in a package (e.g. cake sprinkles)
- variety packs (e.g. strawberry and blueberry)
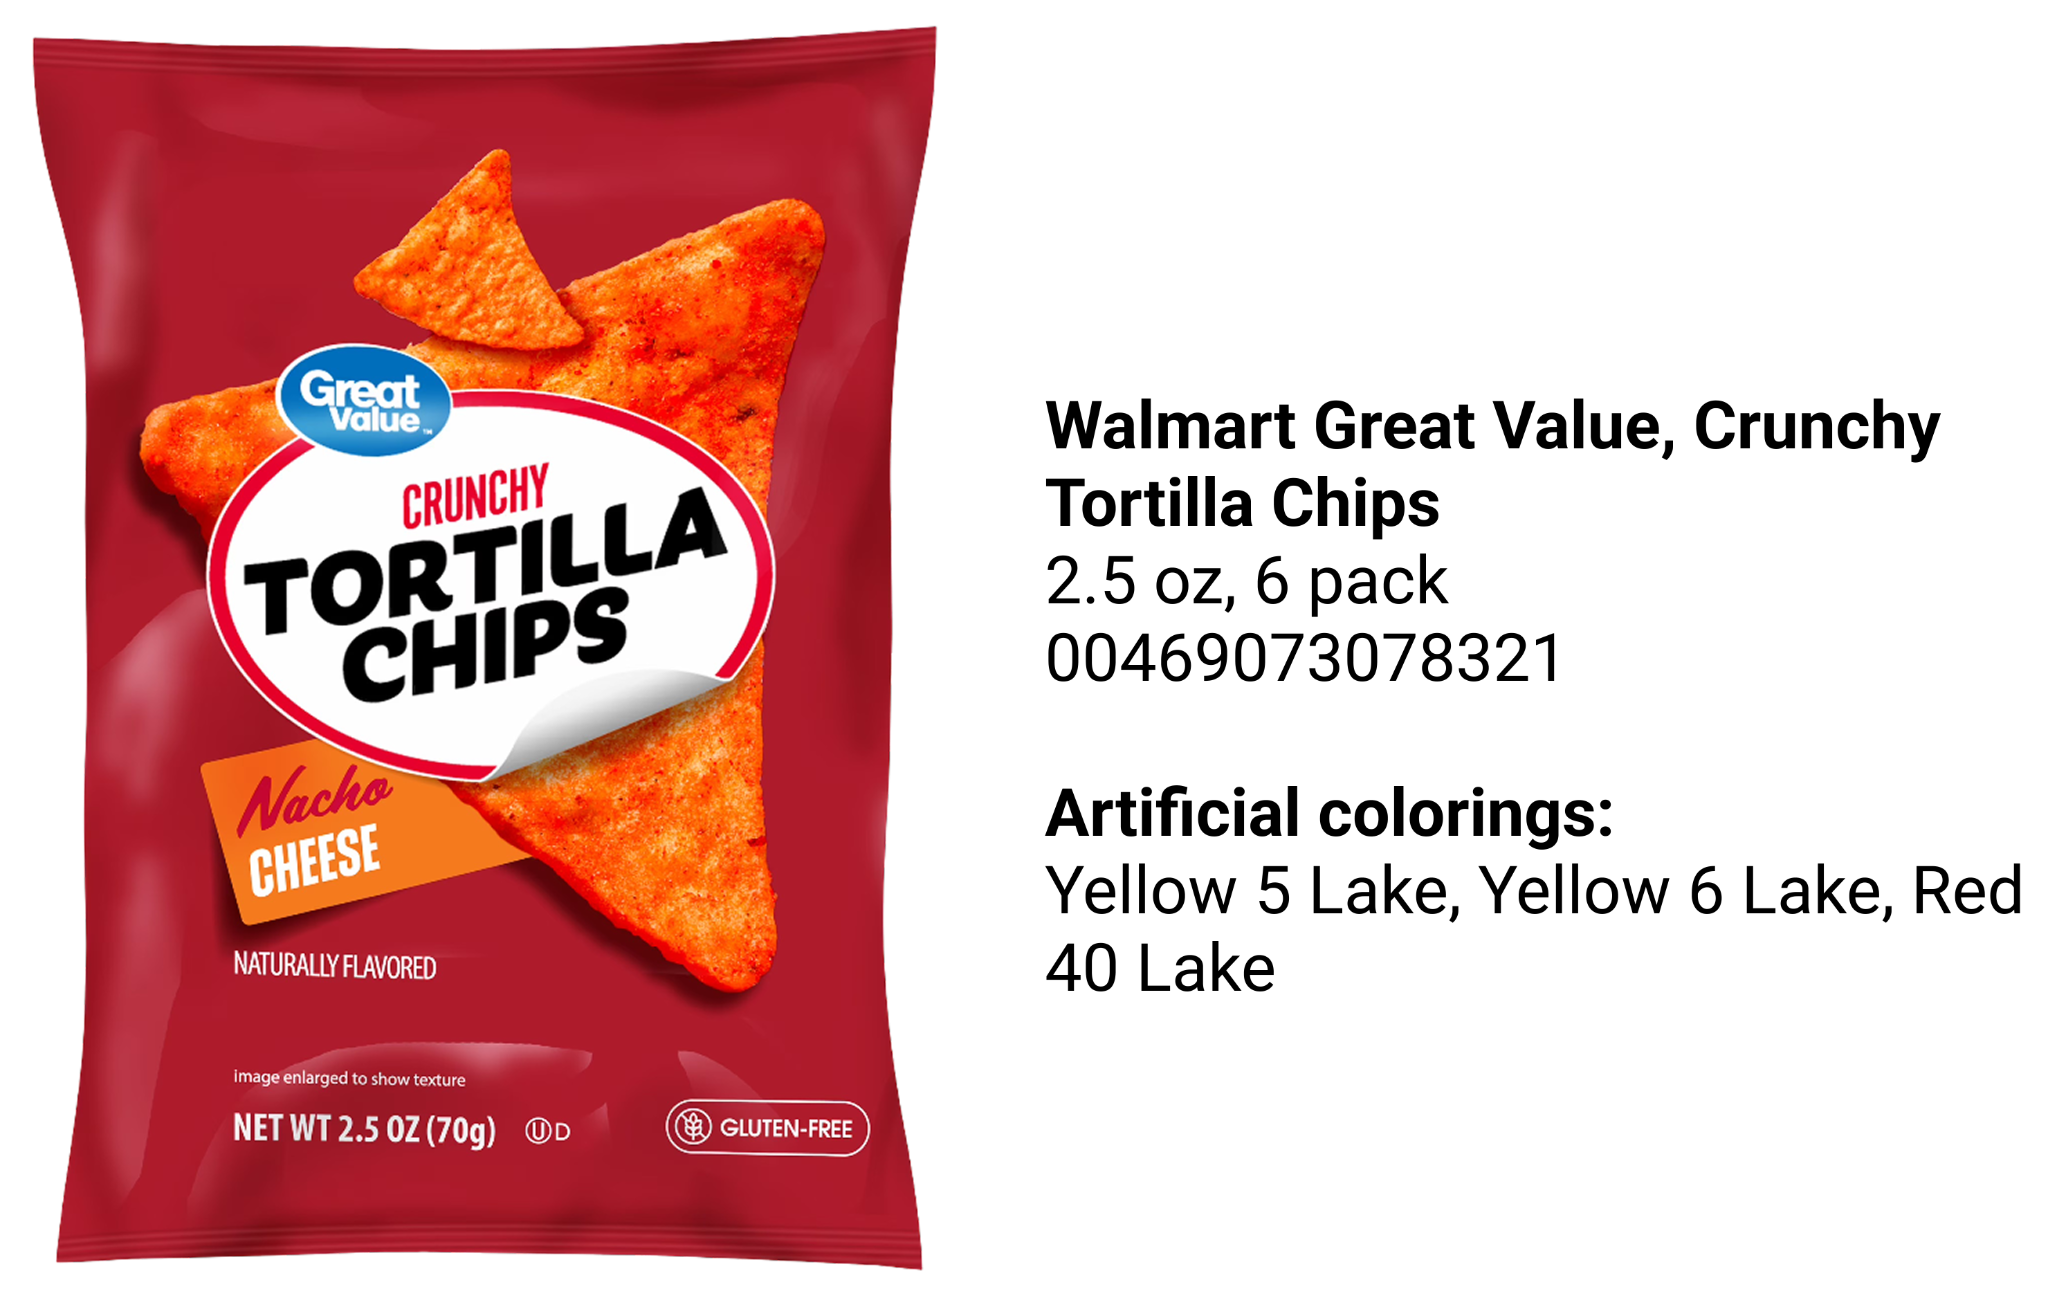
- alternative dye types used in formulation (Yellow 5 and Yellow 5 Lake)
Notable publication: In the first significant review in many years, a study published in the Journal of the Academy of Nutrition and Dietetics in September analyzed the presence of synthetic dyes in U.S. food products. Compared to the Foodgraph analysis, the Journal’s study used a data set from 2020 and evaluated 7,428 products.6
Private Label brands are the most affected
Of course, candy brands (e.g. Skittles ), cookies (Oreo), and soft drinks (Mtn Dew) have synthetic dyes in many products, as do processed meats (Tyson) and Latino foods (Goya).
Because Foodgraph’s catalog includes retailer private label products, our analysis was also able to determine that these brands are the most impacted.
Unlike Mars Wrigley, which primarily sells snacks and candy, retailers such as Walmart and Target sell their own branded products in all categories, so they have many more products with synthetic dyes that may need to be redeveloped.
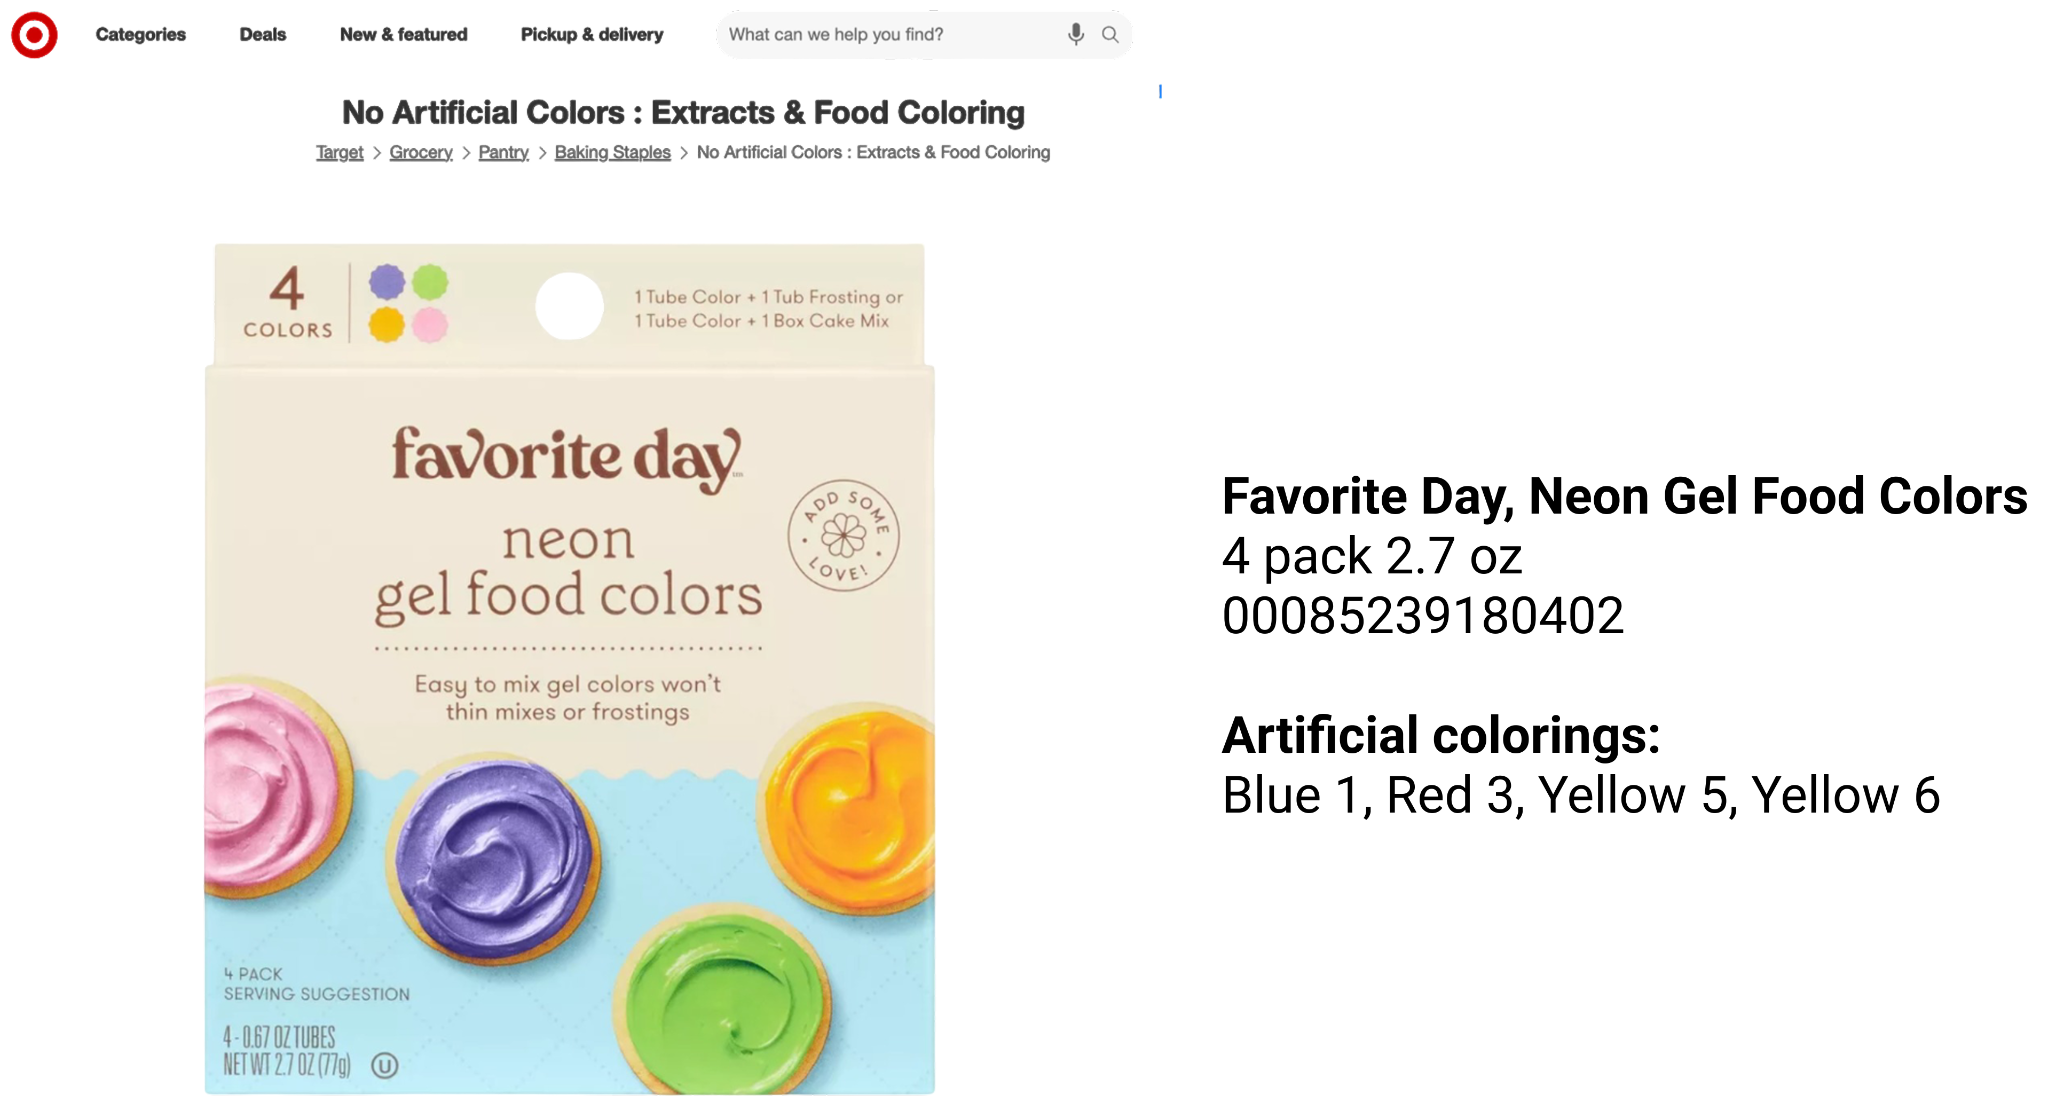
Some retailers are already marketing products based on the absence of synthetic colors using website categories or filters. Understanding artificial vs natural color ingredient names -- despite existing FDA guidelines -- has been challenging. For example, Target promote private label products with synthetic dyes as having No Artificial Colors.
The industry effects will be widespread
An industry-wide replacement of food products is uncommon and highly-disruptive. In 2020, supply chains were severely disrupted due to COVID, resulting in large-scale product changes. Previously, the 2018 U.S. Nutrition Facts labeling changes and the 2006 U.S. food allergen labeling law (FALCPA) may have spurred some ingredient reformulations, but most of the effects were restricted to package redesign.
For changing from artificial to natural coloring, the entire supply chain will be impacted:
- new crops planted
- new additives created
- new ingredients sourced
- new formulations developed
- new manufacturing processes engineered
- new packaging designed
- new assembly lines stood up
- new products distributed
In commerce enablement, data and marketing will be remade across thousands of products:
- new SKUs (stock keeping units) added to catalogs at a much higher volume than normal
- new enriched attributes added to master data catalogs (e.g. “artificial dyes” = [true, false])
- new promotions developed
- new personalization algorithms defined
- new social content designed
- new campaigns rolled out
Some previews of new marketing approaches
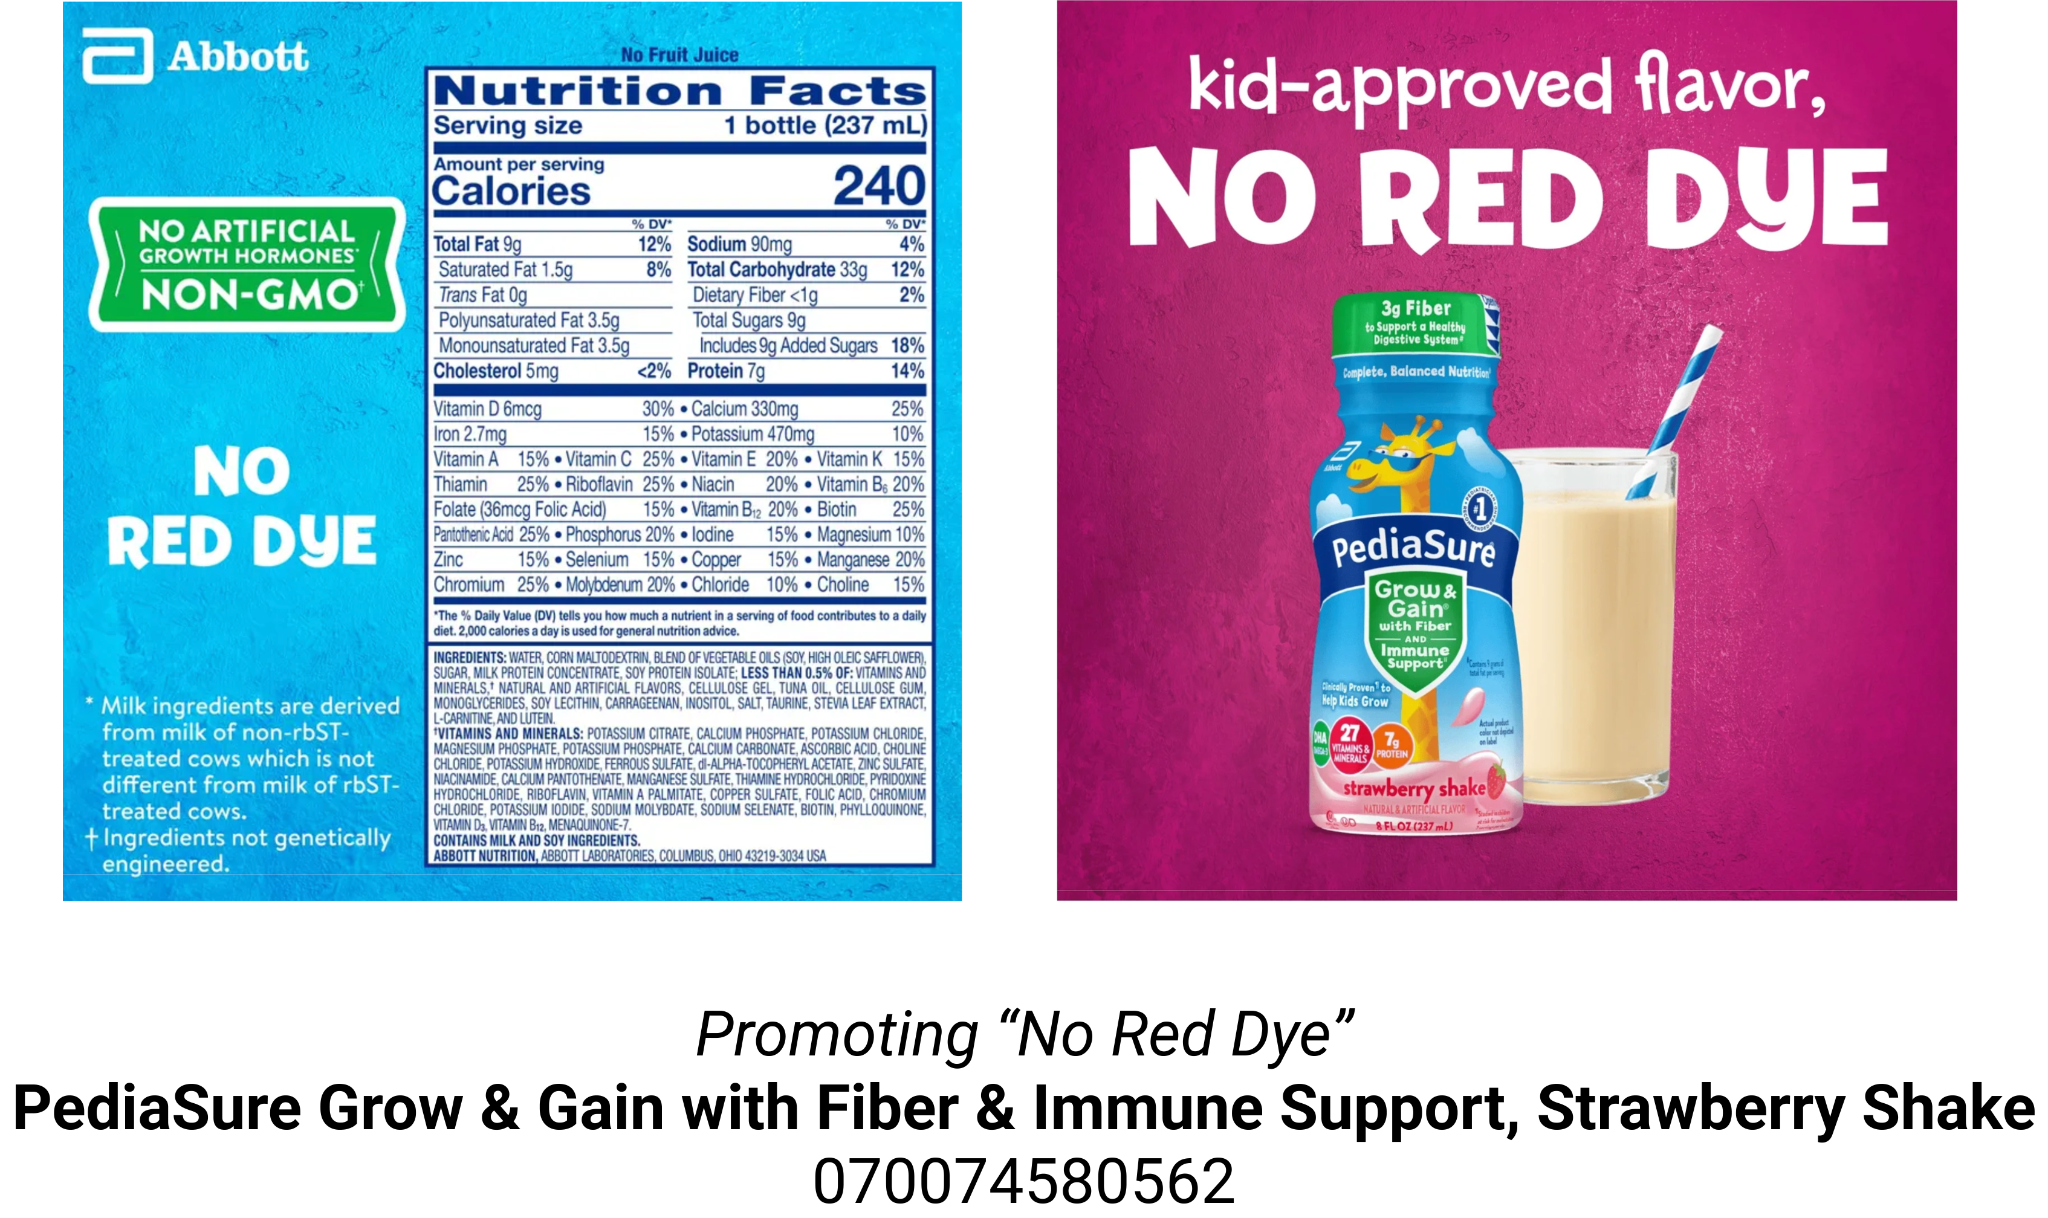
Leading brands are already promoting natural ingredients in existing products, as shown below:
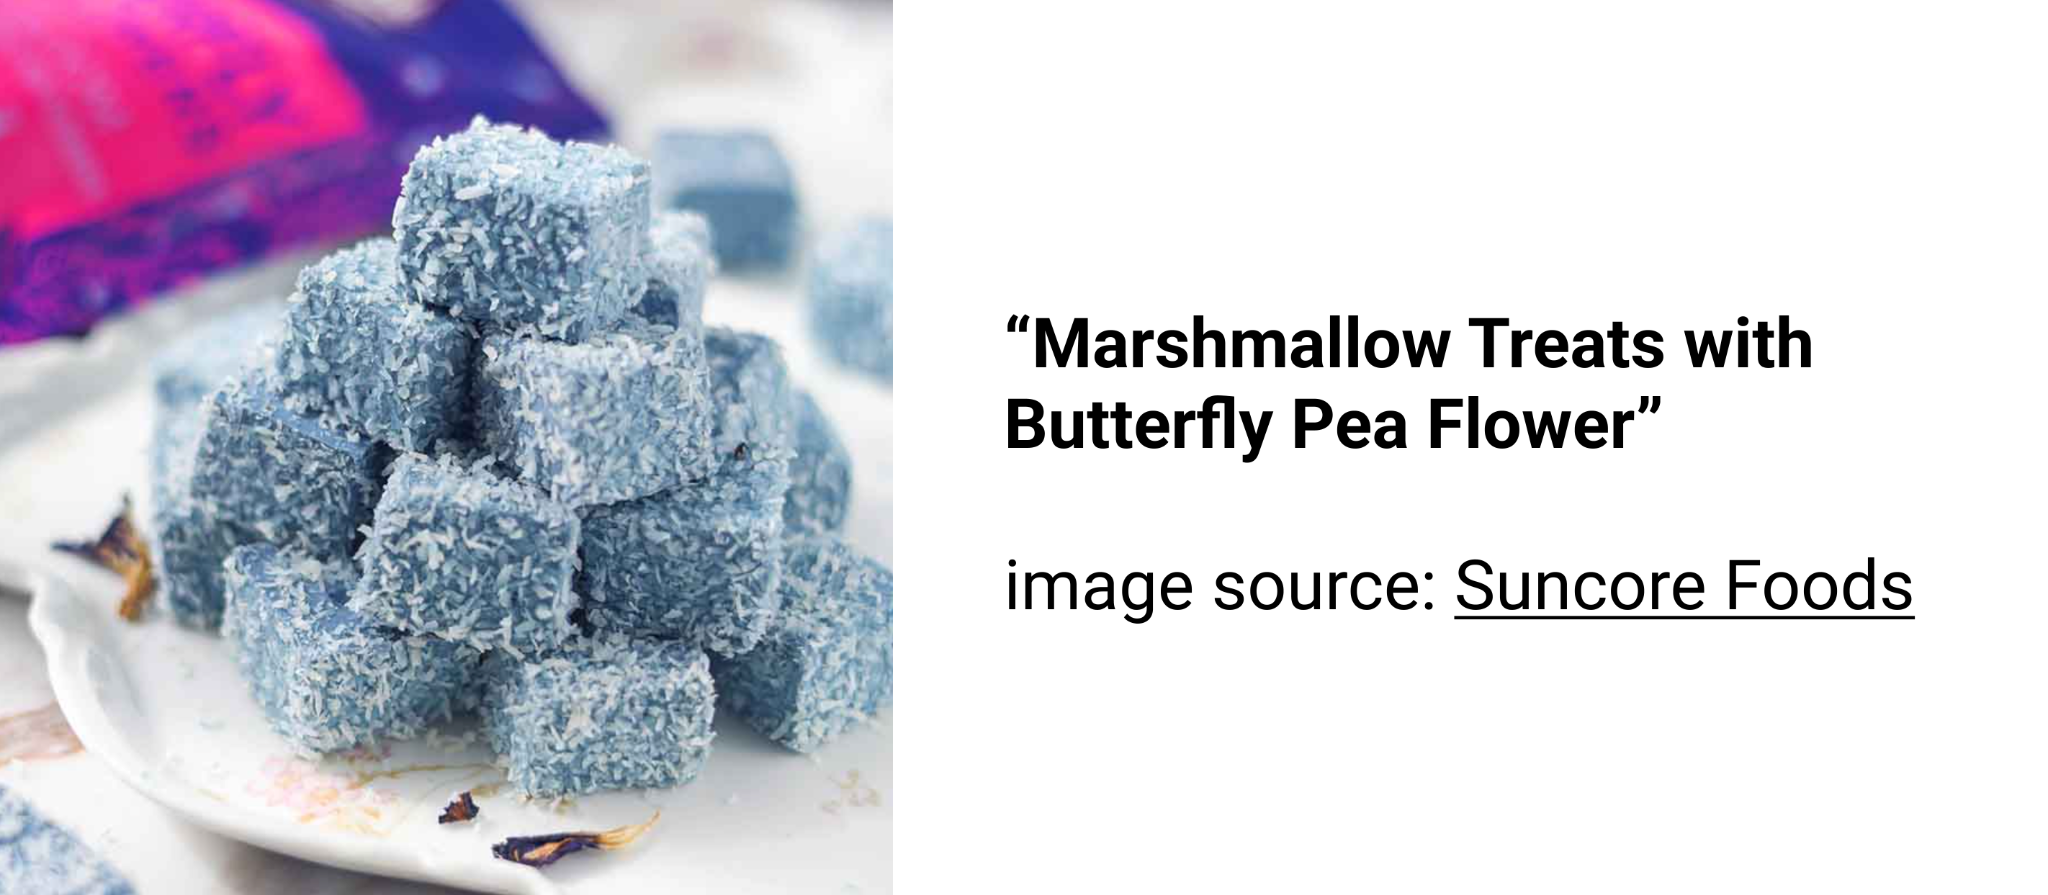
New products can even be ideated using new natural colorings:
About Foodgraph
Foodgraph has built the largest and freshest data catalog of U.S. grocery products. Our platform powers smarter decisions across the grocery ecosystem. Using our national catalog and data quality, companies can turn this regulatory shift into a competitive edge.
- Track compliance: Monitor synthetic dye removals across categories and brands.
- Benchmark competitively: Compare product attributes and positioning against peers.
- Audit content at scale: Identify gaps in labeling, claims, and digital shelf presence.
- Accelerate innovation: Discover ingredient trends and leverage natural colorings to ideate and launch new products faster.
Let’s Talk
Contact us to gain a competitive advantage during the synthetic dye transition.
Endnotes
1. In the FDA’s original news release of April 22, 2025, HHS, FDA to Phase Out Petroleum-Based Synthetic Dyes in Nation’s Food Supply, the regulator stated that it is “working with industry to eliminate [the] six remaining synthetic dyes … from the food supply by the end of next year,” i.e. 2026.
Since then, the FDA has provided updates on this webpage,Tracking Food Industry Pledges to Remove Petroleum Based Food Dyes and stated it is working to “eliminate [the] six remaining certified color additives by the end of 2027.
Even more recently, in the news release FDA Proposes Revocation of Authorization for Orange B in Food, the agency wants to remove petroleum-based food dyes in products sold in schools by the start of the 2026 school year and more broadly by 2027.
The agency has also added the remaining certified synthetic dyes to its List of Select Chemicals in the Food Supply Under FDA Review, meaning that it may be “revoking authorizations or approvals for certain uses.”
The approximate color swatches in this section were captured from the International Association of Color Manufacturers (IACM), Color Library, the University of Florida, and other public sources.
2. More industry support for the FDA’s new synthetic dye policies: Conagra, Danone, General Mills, Grupo Bimbo, J.M. Smucker, Kraft Heinz, Mars Wrigley, Nestlé USA, PepsiCo, Sam's Club (Walmart), Tyson Foods, and WK Kellogg
3. The Wall Street Journal, Why Phasing Out Artificial Food Dyes Is So Complex, July 8, 2025 (at 2:38)
4. According to FMI, top tier color additive manufacturers with U.S. headquarters include Archer Daniels Midland (ADM) and Sensient, with other U.S. leaders companies such as DDW, Ingredion, Kalsec, and McCormick. They will face strong competition from top tier foreign companies Chr. Hansen, DIC (BASF), DSM, and Symrise, and beyond the top tier, Dӧhler, GNT and Synthite.
5. Source: Foodgraph catalog v40 release, August 1, 2025
Sub-sources: 29 data sets from brand syndicators, retail and wholesale websites, and the USDA
Data set: 801,231 products, including private label, large brands, and small brands, and for both food & non-food
Selection: 563,854 packaged food products with ingredients
Excluded: alcohol, health & beauty, household, medicines, and pet supply products
Analysis: AI-assisted queries for FDA-compliant dye names and non-compliant dye names, as they have been published by brand and retailers for consumer use on grocer websites and printed labels.
6. The Journal’s timely study is the first significant analysis in many years to address the presence of synthetic dyes in food.
The lead finding was: “Synthetic dyes were present in 19% of products” in 2020.
(N=7,428 products, after blank and bad data values were removed).
The study:
- analyzed a 2020 data set from a product catalog provided by Label Insight, with 426,980 products (compared to our catalog of 874,758 products).
- selected products for only the “top 25 manufacturers” (brand owners), yielding a sample of 50,929 products.
Some limitations of the source data affected its findings:
- No products introduced since 2020 were available in the source data (i.e. post-COVID).
- No private label brands were included or available in the source data. For example, Walmart’s 2,500+ private label food products -- such as “Great Value” and “bettergoods” -- were absent. The total number of Walmart own food products is larger than 20 of the 25 brands that were included in the study.
More generally, private label products account for about 23% of units sold, and are growing 4x faster than major brands, per the Private Label Manufacturer’s Association (PLMA), 2025 Private Label Report. - No ingredient changes in the past 5 years were available from the source data. Significant product reformulations occurred during and after COVID supply chain disruptions.
- No mid- and small-brand products were included or were not available from the source data.
More to explore
Discover additional articles, updates, and perspectives.

Context Graph for CPG
David: What does “context” mean for data platforms?
Ophir: Ever since we started tackling the problem of messy, fractured product data, we found that domain knowledge is the key to making good decisions.
Context in AI goes beyond recording state data and decision traces. It must include the basis of the decision. For specific verticals — like CPG — the reasoning is usually embedded in industry-specific domain knowledge.
David: What does this mean in real life?
Ophir: A key aspect of our data platform is that industry knowledge is embedded in our logic. But the more expertise that we added, it became harder to manage, especially for performing QA.
This problem led us to add human-readable “context” right alongside the data results. This approach was powerful and efficient. It enabled agents, analysts, and developers to trace the chain of decisions for audit or validation.
Context is embedded vertically in our stack. Throughout our schema and processes, we can observe the entire "sausage-making" process, with natural language traces that lead clearly to the final outcomes.
David: Can you give some examples of domain knowledge about CPG products?
Ada: Sure, for example: How are units of measure correctly expressed in food versus non-food products? We see unexpected mutations all the time, such as made-up or foreign acronyms, even from “sources of truth” such as brand syndication and major retailers.
John: Another example: FDA regulations can be used to validate Nutrition Facts data. The FDA has strict requirements, which are codified in the Federal Register and have the force of law, but are often not applied on product description pages.
David: We see all the time how FDA regulations about food labeling, as expressed in the FD&C Act, are often violated on retail websites.
How do retailers get away with it? Because unlike food brands, grocers are not subject to federal oversight of product description pages.
Ophir: These are good examples of how we use domain knowledge to make decisions about normalizing, fixing, and enriching attribute values. While we don’t know about travel and automobiles, we do know CPG.
David: How does recording context help?

Ophir: Context is necessary to describe why decisions were made. It must be easily observable, auditable, and stored as first-class data.
David: Aren’t some data sources always reliable, so context about decision-making isn’t needed?
Ophir: Among the 47 sources we currently ingest, all have significant gaps and inaccuracies.
Ada: Some data sources have excellent quality, but only cover a subset of brands. Others, like syndicators, don’t have private label products. And long-tail SKUs are specific to each source, or not present at all.
John: Yes, and key attributes are often missing, such as images or net weight.
David: Sounds like a mess. How do we deal with it?
Ophir: We expect data chaos. Gaps and errors are the problems we solve for.
David: Aren't LLMs a reliable source of product data?
Ophir: Looking at generic AI results, they do a great job at synthesizing and generating data. But general LLMs don’t have vertical knowledge to classify with accuracy, correct errors, derive missing values, or adjudicate conflicts.
Ada: The answers from LLMs are only as good as the information they gather. We often see inaccurate results from general AI search and tools. Garbage in, garbage out still applies in the age of AI.
David: Is the answer to throw an army of human experts at the problems?
John: Human experts do have the knowledge, but an army of them is expensive and hard to manage. However, their knowledge can be embedded in vertical AI to create quality data at scale.
David: When did we start using context?
Ophir: We architected context from the beginning. We just didn’t call it a “Context Graph” because that term didn’t exist. Handling context as first-class data enables our systems and people to do their jobs better. We embed our expertise to improve quality and frequency, then capture how that expertise was used to create those better outcomes.
Ada: A simple example is knowing that cocktail mixers like tonic are non-alcoholic, even if retailers or brands list them in an alcohol category.
John: LLMs often get this classification wrong too. Humans like Ada never do 🙂.
David: These CPG nuances matter in lots of use cases, such as PDPs, digital analytics, nutrition and even price optimization.
Ophir: As our contexts grow, our learning compounds. The more we add to the graph, the more we are able to do better. Compare this context approach with hard-coded rules for addressing endless edge cases. That becomes unwieldy and doesn’t scale.
David: When does the Context Graph come into play?
Ophir: In our view, a Context Graph is systems of agents that enable autonomous decision-making across workflows. This full AI autonomy — when AI makes decisions across workflows — has not yet arrived. We see the benefits and the paths to get there, and we are working towards them.
David: Where are we on the journey to a Context Graph?
Ophir: The first requirement is having an AI Native system, with schemas and processes that are designed for context, not just state and observability. We re-architected our systems to be fully AI Native in 2024.
Second, we treat context data as “first class.” This means the "Why" data is of equal importance to all other data types.
Third, our agents already utilize context data to decide, store, observe, and audit decisions in discrete workflows.
We believe that the full concept of the Context Graph will be realized when systems of agents — not just specific services — can exercise autonomy across workflows with provable superiority.
David: Why not sacrifice quality to be more efficient?
Ada: Our value proposition is strongly rooted in quality data.
John: We aggressively lean into AI, but we won’t “ship it” if the results are not better or cause harm.
Ophir: We see a clear path to the Context Graph. We believe it describes how data businesses will scale in the age of AI, with quality and efficiency, grounded in domain knowledge.
David: Thank you, Ophir, John, & Ada. Glad to be on this journey with you!
For our first mention of the Context Graph, see our recent blog post The CPG Showdown: Love vs Strength.
For more on how context graphs are being discussed across the tech and venture communities, see What are context graphs by Simple.AI and Context graphs one month in by Foundation Capital.
For the original Context Graph idea, see AI's trillion-dollar opportunity: Context graphs, by Foundation Capital.
Thank you for following our progress. Send me a note with thoughts or questions. I’d love to hear how we can support your work.
Warm Regards,

David Goodtree
Founder and CEO, Foodgraph
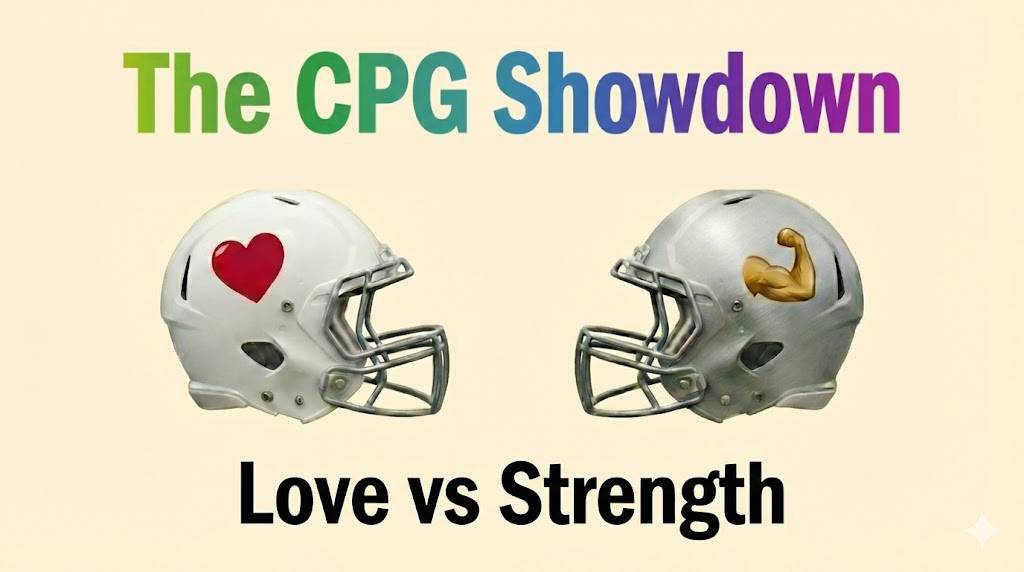
CPG Showdown: Love vs Strength
February is an annual showdown among new seasonal food products, pitting love vs. strength.
- For romantics, Valentine’s Day ♥️ product introductions command top placement on the digital shelf and store endcaps.
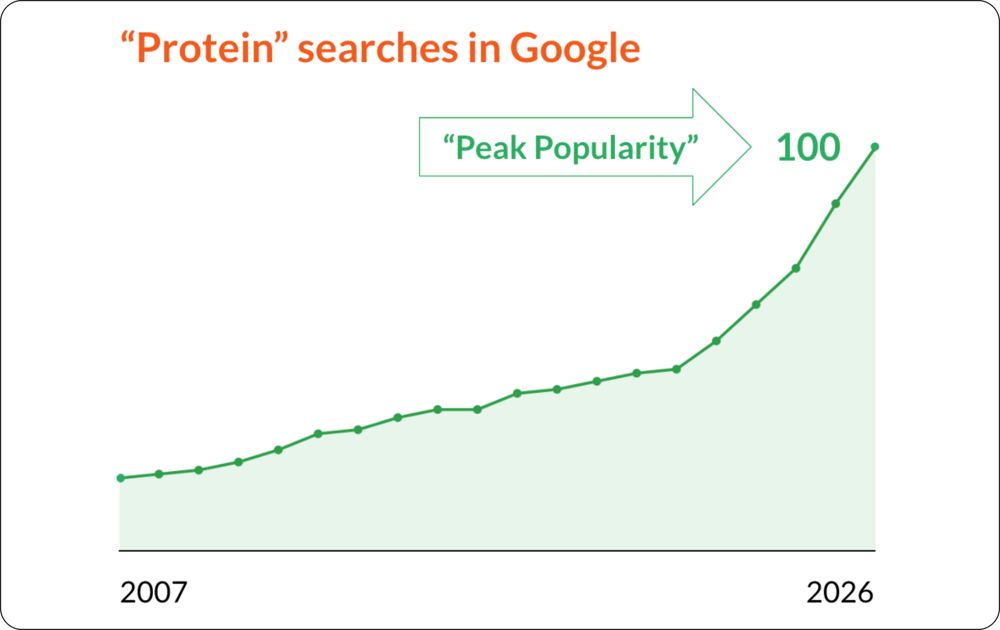
- For health & wellness enthusiasts, interest in protein-rich products has reached an all-time high in 2026, driven by New Year’s resolutions for improved strength 💪🏼 and functional diets.
Welcome to Foodgraph’s newest catalog, packed with new products and updated attributes, across food and non-food categories. Our newest release (v48) includes 1,380,000+ products, up 119% in the past year.
Protein hits all-time high
Consumer interest in protein-enriched foods hit a 20-year high in the new year. Brands of all types continue to bulk up their products with protein-forward positioning. Across all food aisles, here are some of the newest 1,000 protein-titled food products in our latest catalog release.
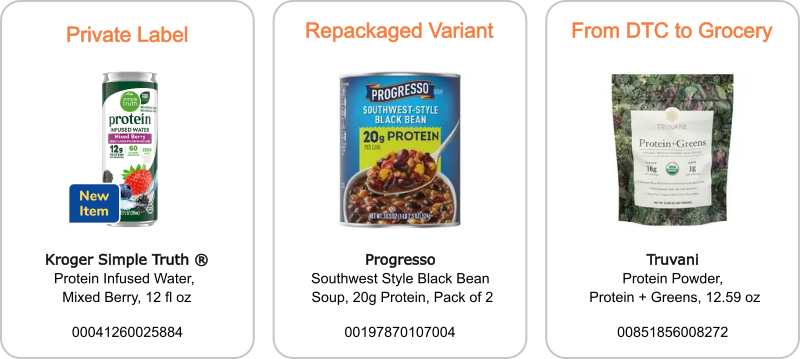
Private label retailers are aggressively launching protein-centric offers.
- Kroger is betting big on protein going into the New Year with 110 “Simple Truth Protein” products -- such as bowls, chips, and infused waters.
- H-E-B rolled out “Protein Lifestyle” meals on December 31, focusing on convenience.
- Sprouts’ eCommerce storefront leads with Find Your Protein Routine, featuring hundreds of meat and plant-based items.
Big CPG innovates, but can’t keep up with demand.
- Danone’s high-protein yogurt brands Oikos and Activia cannot serve all the demand, with supply chain constraints blocking sales and stalling innovation.
- Barilla’s Protein+ product line is broadening its portfolio, but the company recognizes it’s not always first to launch new items in its category.
- DTC brands like 1440 Foods and Truvani -- a common channel for protein powders, bars, and supplements -- are now scoring shelf space at grocers Raley’s, Sprouts, and Walmart.
- Newer brands like Kola and Whey Good are grabbing slots when big CPG has gaps.
The FDA’s new Dietary Guidelines for Americans, 2025-2030 moved protein to the top of the list, encouraging consumers to “Prioritize Protein Foods at Every Meal”.
Google searches for protein achieved “Peak Popularity” for the first time in 20 years, reaching the highest-level of interest relative to all Google search terms, including both AI and traditional methods. Here’s a snapshot using data from Google Trends:
Valentine’s Day 2026
New products for Valentine’s Day showcase how Foodgraph’s catalog is rich with opportunities to explore actual product trends and which brands are leading.

Dubai chocolate continues to skyrocket.
- 79 Dubai Chocolate products are now in circulation, up 500%+ since 12 in August, and up from zero products a year ago.
- Smaller brands dominate the shelf, such as BeeMax, Leonessa, and Nutty & Fruity.
Big CPG missed the start of the trend.
- Since the summer, Ghirardelli and Lindt caught up and launched new products in time for Christmas and Valentine’s Day.
- But Hershey’s doesn’t believe in Dubai Chocolate’s staying power, saying "Only 10,000 exist. Ever. This isn't going into regular production."
- Nestlé’s Damak brand already had chocolate/pistachio products, but hasn’t yet repositioned packaging to “Dubai Chocolate”, missing out on consumer awareness.
Pistachio health & beauty products have caught the Dubai wave.
- Pistachio -- a key ingredient in Dubai chocolate -- has taken the non-food aisles by storm.
- Body creams, candies, and perfumes -- with pistachio scents -- are in rotation now.
Foodgraph saw CPG’s embrace of this trend early.
- See our August blog for more info about Dubai Chocolate: School’s In. So Are 60,000+ New SKUs.
Ramping up data sources
Our newest release adds 17 new retailers to the catalog, now incorporating 47 data sources in total, up 235% in the past year.
All new sources include CPG products in food, plus alcohol, health & beauty, household, and pet.
To represent the national product assortment, our mix of sources includes retailers -- to capture the explosion of new private label products -- plus brand syndicators, wholesalers, and government.
Foodgraph News and Next Catalog
Welcome to our new Head of Sales Andrew Haney, who joins Foodgraph with deep industry experience across retail and CPG at Toluna, Profitero, Epsilon, and Nielsen. Please reach out to connect.
Our next major update arrives in March, with more products and fresh data for Easter, Passover, and St. Patrick’s Day.
Thank you for following our progress. Send me a note with thoughts or questions. I’d love to hear how we can support your work.
Warm Regards,
David Goodtree
Founder and CEO, Foodgraph
Beyond the Food Aisles
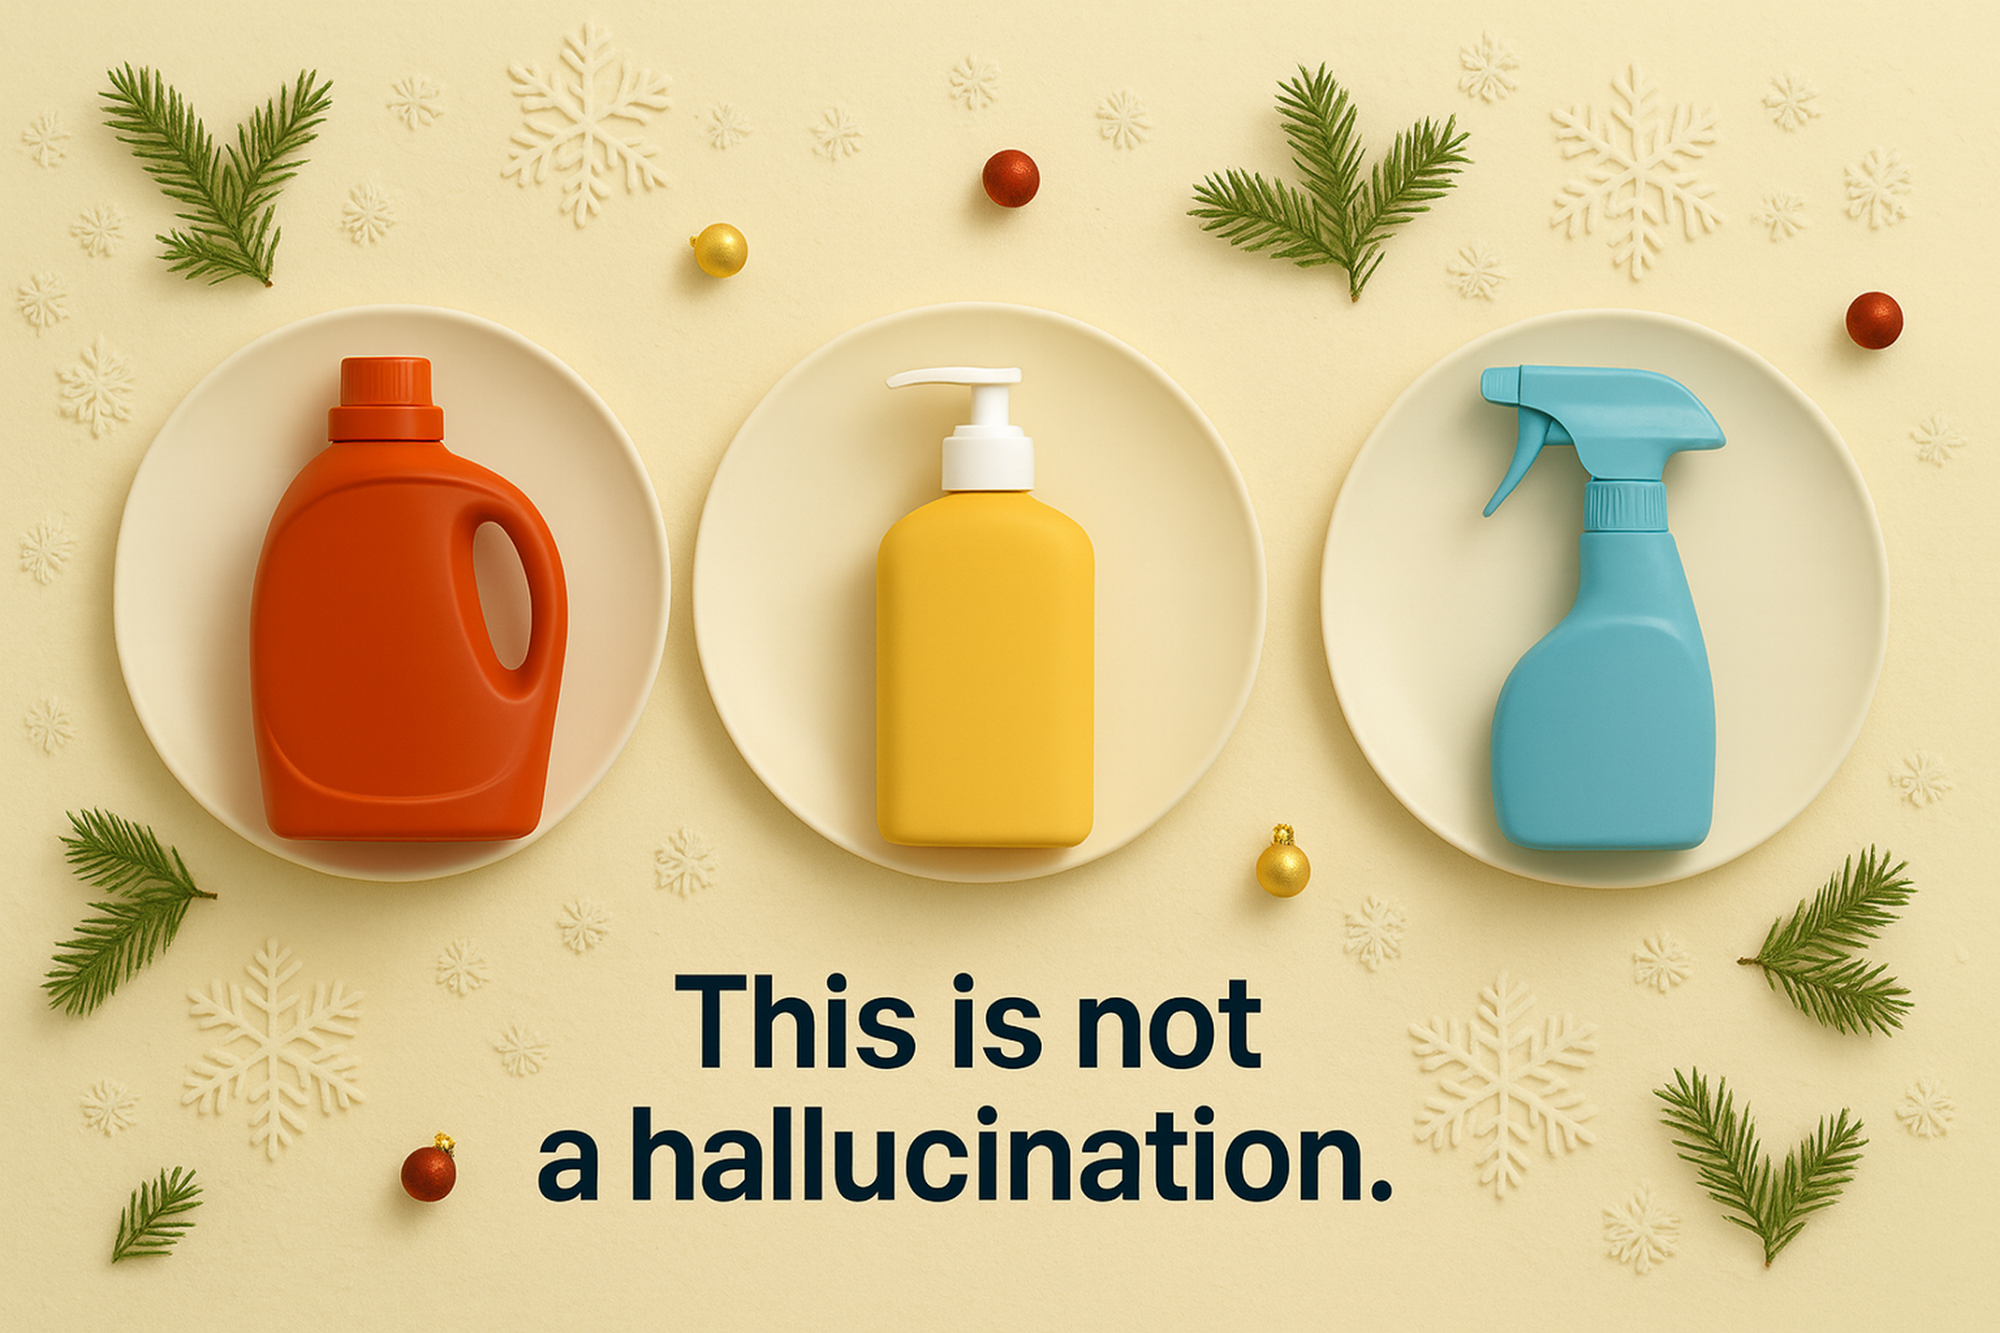
“Honey, did you get the scented candles at the supermarket?"
Grocery shopping in non-food aisles is seeing a renaissance in innovation and seasonal products.
Our newest catalog adds 130,000+ products, capturing a huge wave of innovation in health & beauty, household, pet, and more.
Foodgraph captures what’s on the shelf right now, free of hallucinations.
Private Label: More Than a Value Play
Major retailers are rolling out private label innovations in every aisle, capturing bigger margins and consumer loyalty.
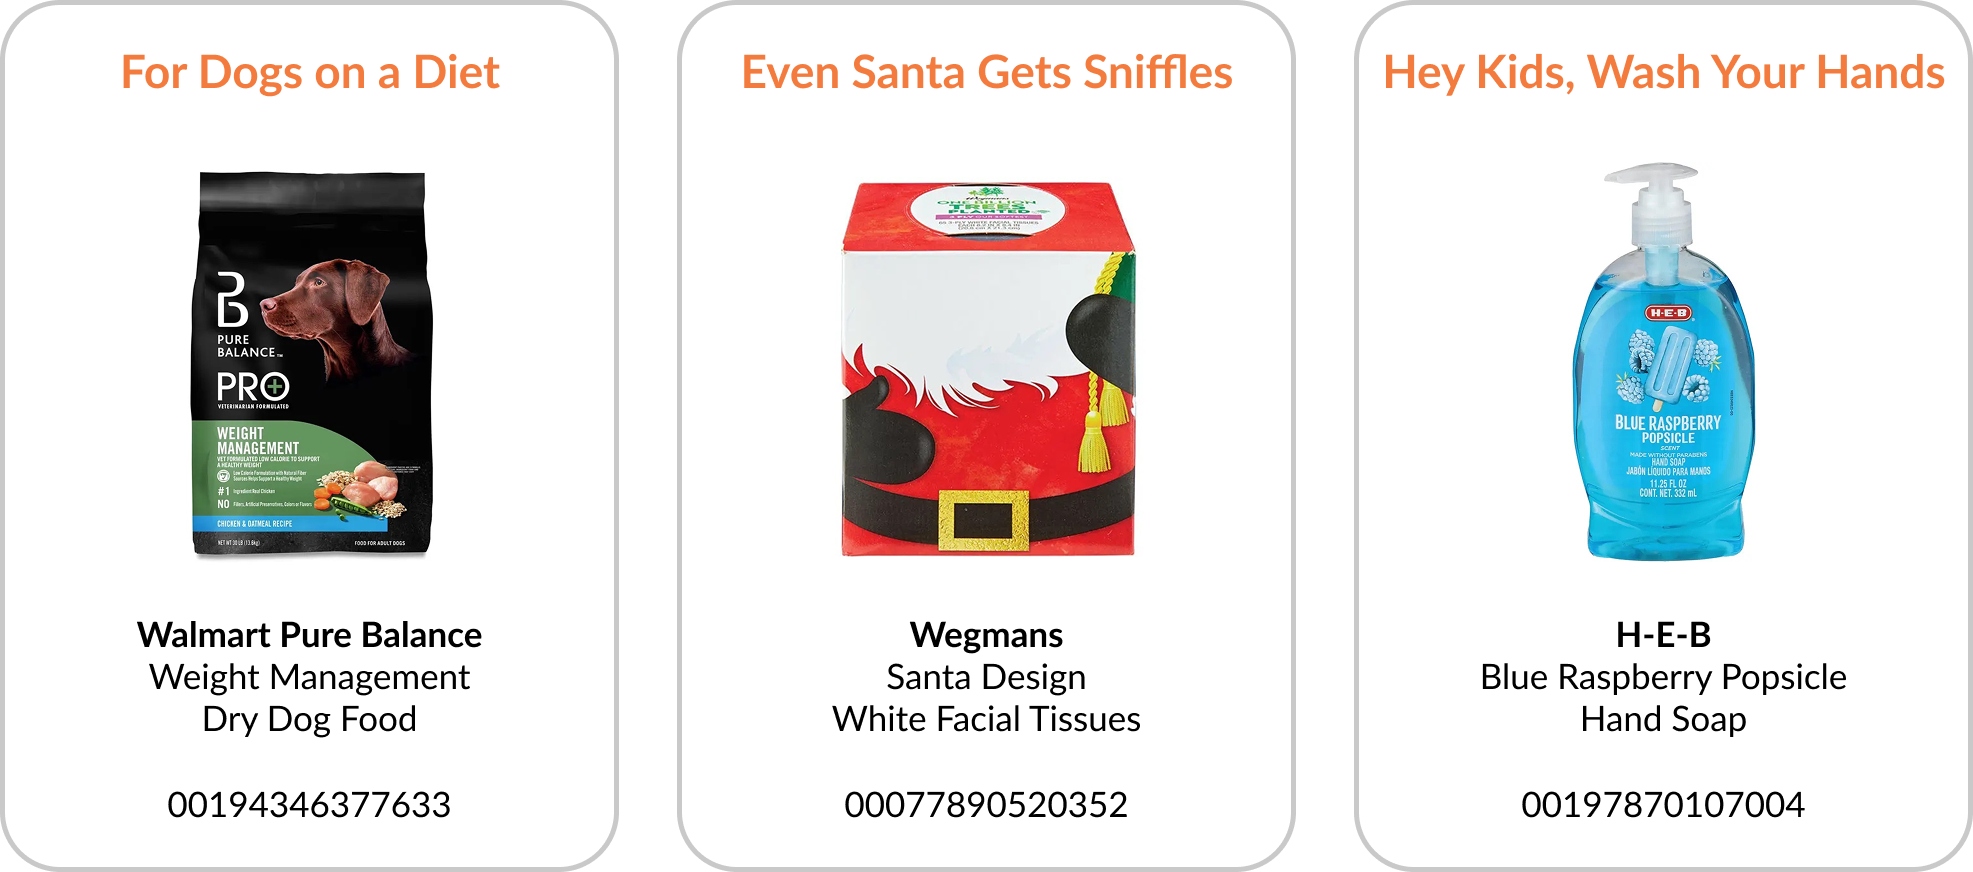
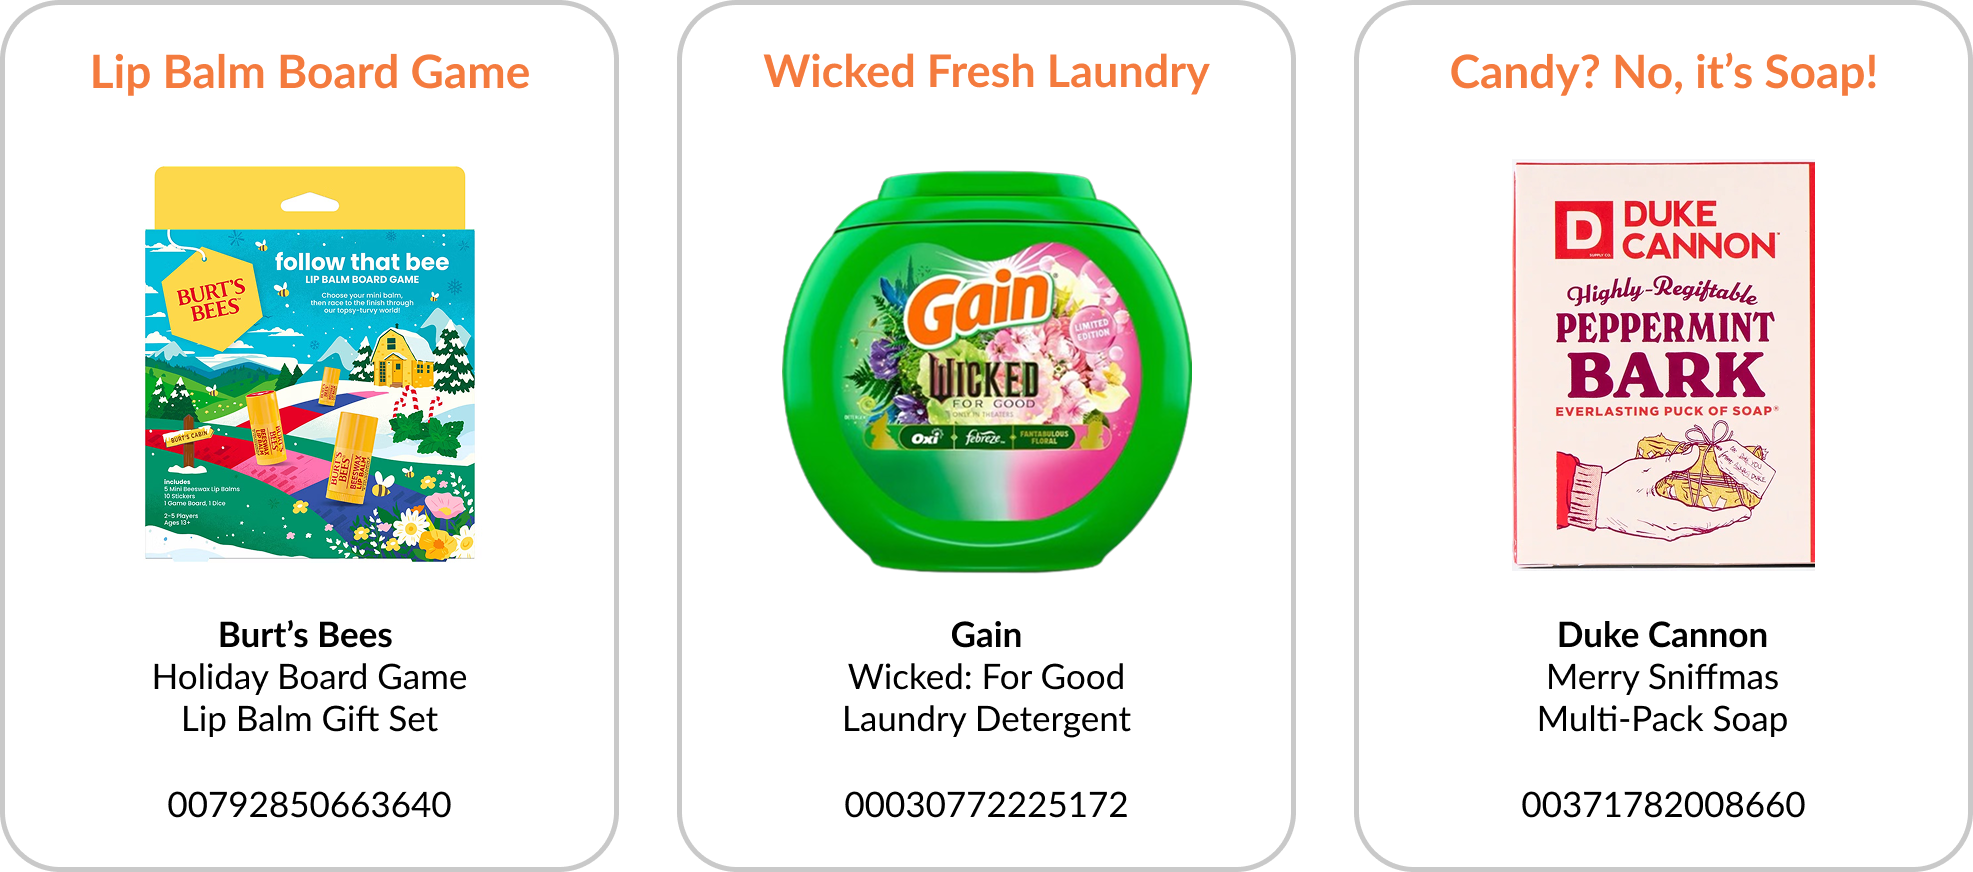
Limited Availability, No Cooking Required
Seasonal and promotional offerings -- even in non-food aisles -- make grocery a destination year-round.
And, the numbers are impressive. Private label products in household grabbed 28% of unit volume as of September 2025, achieving 99% household penetration, according to Numerator. Other non-food categories are close behind.
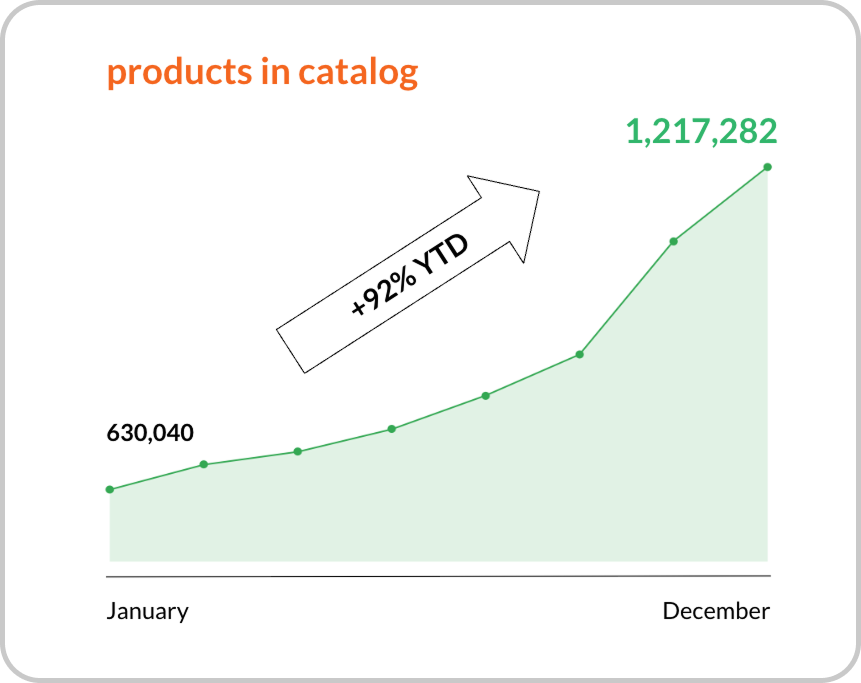
A Year of Growth, in Every Category
Foodgraph’s v46 release includes 1,200,000+ products, up 92% year to date across all aisles.
Foodgraph's accelerating growth is driven by our nationwide data acquisition strategy, from large brands to the long tail, plus:
- private label’s rapid expansion in all categories
- eCommerce bursting with assortments that often exceed the in-store mix
- seasonal variants innovating with new flavors, scents, and packaging
Next Catalog
Our next major catalog update arrives in January, with more new products and fresh data in all aisles.
Thank you for following our progress. For more information, send me a note. I’d love to hear how we can support your work.
Warm Regards,
David Goodtree
Founder and CEO, Foodgraph
Get better CPG product data today.
Book a demo today to learn how Foodgraph can help.